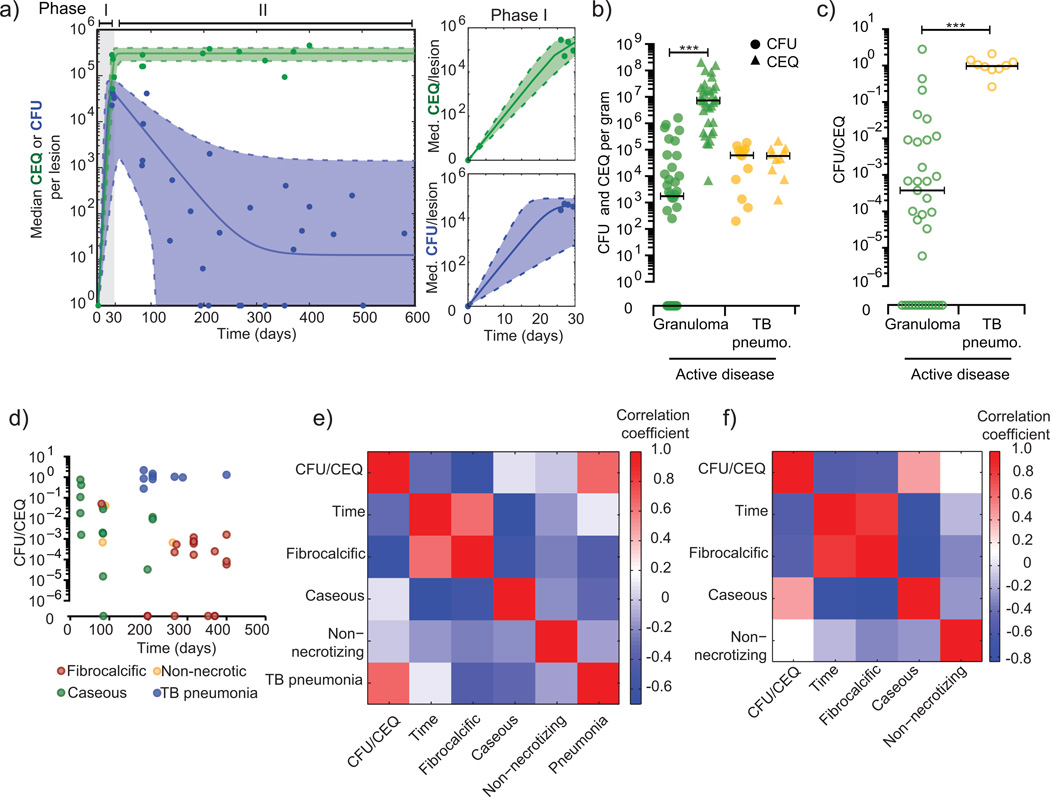
Figure 4. Models and correlates of replication and killing.
(a) Median CEQ (green) and CFU (blue) were fit with ordinary differential equations describing growth and death in individual lesions. t0 data were inferred from our barcode data suggesting most granulomas start with a single bacterium. CFU data were modeled as two phases – phase I represents initial growth (t = 0:30 days); phase II represents a subsequent killing (t = 30:600 days). Doubling times in individual lesions were inferred from CEQ and CFU fitted curves (Supplemental Table 3). Phase I is shown in detail in panels on the right, and validated against 3 week CFU samples in Supplemental Figure 3. (b) CFU (circles) and CEQ (triangles) per gram of tissue are shown for granulomas from active disease animals or sites with TB pneumonia. (c) The ratio of CFU/gm to CEQ/gm in TB pneumonia samples suggests reduced killing at these sites. (d) Plotting time, histopathology, and CFU/CEQ reveals associations between these variables. (e) A correlation matrix reveals that the characteristics TB pneumonia (r = 0.66, p = 9.24E-07) and fibrocalcific (r = −0.62, p = 6.95E-06) are significantly correlated with CFU/CEQ, though to opposite effect. TB pneumonia is positively correlated with CFU/CEQ (i.e. little killing), and poorly correlated with time. Both fibrocalcific and caseous lesions are correlated with time p.i. (f) We removed TB pneumonia samples from the analysis to focus on granulomatous sites. Time is significantly correlated with CFU/CEQ (r = −0.53, p = 0.001), suggesting that killing increases over time in these lesions and the dominant histopathology switches from caseous to fibrocalcific.

