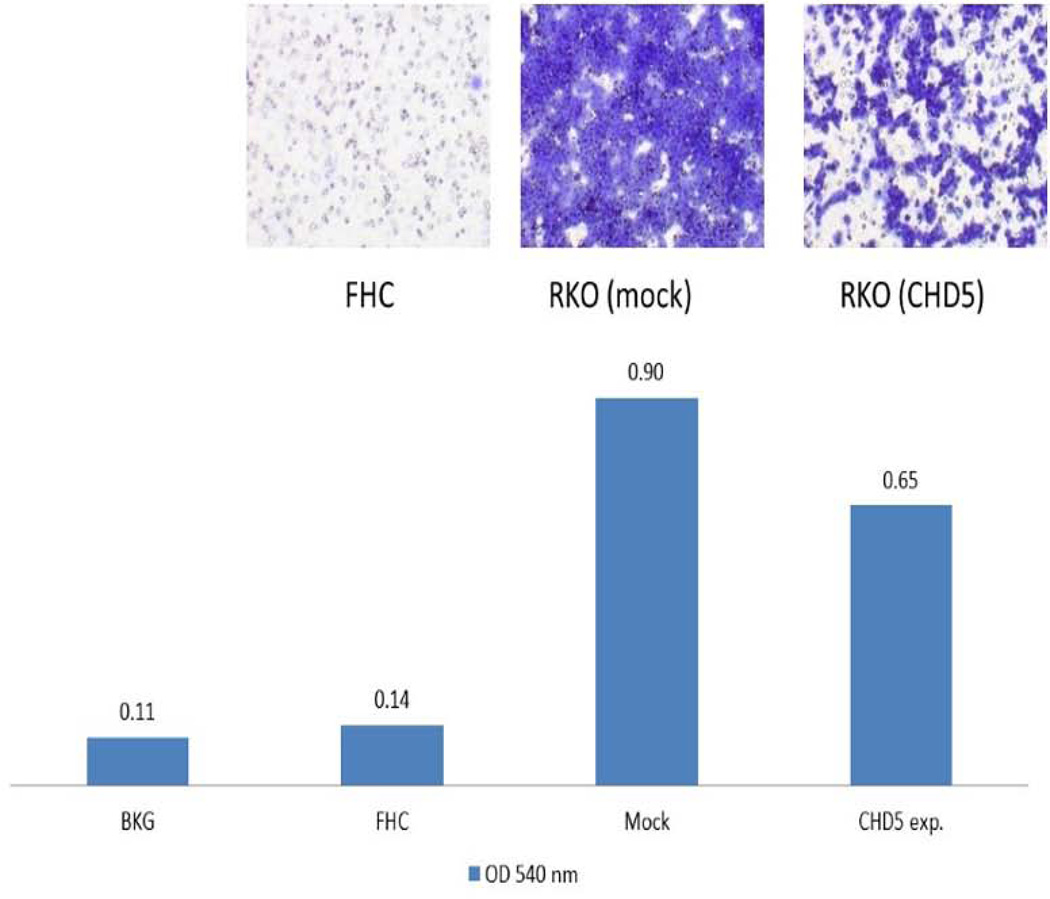
Figure 4.
Effect of CHD5 on cell migration. Cell migration of RKO cell line after stable transfection of the CHD5 expressing plasmid as determined on a polycarbonate membrane (8 µm pore size). The bar chart shows the intensity of cell migration of each experiment. BKG: Background; FHC: Normal Fibroblast Human Colon cell line; Mock: negative control, CHD5 antisense expressing plasmid; and CHD5 exp=the RKO induced CHD5 expressing cell line.

