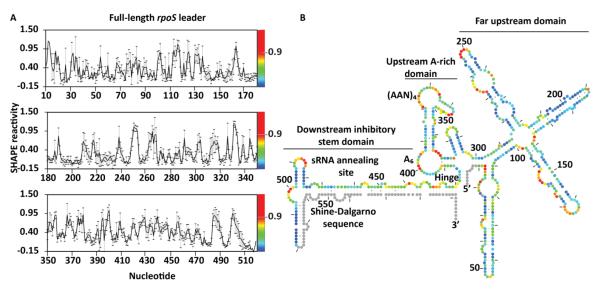
Figure 1. Structural model of the full-length rpoS leader.
(A) Normalized SHAPE reactivity of individual nucleotides, showing the average modification (black line) and standard deviation (error bars) for at least three independent trials. The relative reactivity is represented in the spectrum from red (more reactive) to blue (less reactive). (B) Secondary structure of the full-length rpoS leader predicted by RNAstructure using SHAPE modification as an energy constraint. Colors as in (A). Grey circles represent 5′ and 3′ sequences that were not mapped in our experiments. The far upstream, A-rich and inhibitory stem-loop domains are indicated. The hinge refers to the flexible helix that connects the A6 loop and the inhibitory stem.

