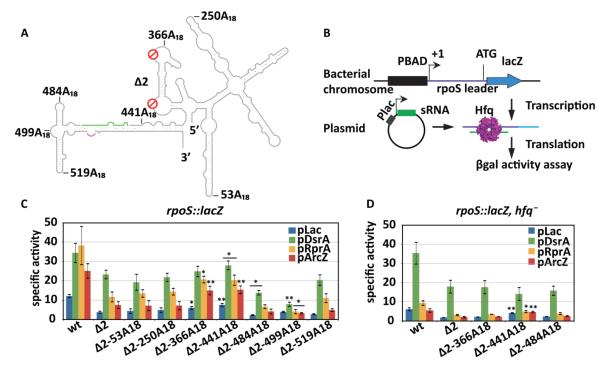
Figure 2. Hfq location determines rpoS translational activation in vivo.
(A) Schematic representation of A18 insertions in the full-length rpoS leader lacking both A-rich motifs (Δ2). The positions are numbered from the rpoS transcription start site. The sRNA annealing site, green; Shine-Dalgarno, purple. (B) Experimental design. The rpoS leader sequence (606 nt) was fused with a chromosomal lacZ downstream of a PBAD promoter. DsrA, RprA, or ArcZ sRNA was overexpressed from the Plac promoter on plasmids. Hfq was expressed from its endogenous gene. (C) sRNA activation of rpoS-lacZ translation. Specific activity of β-galactosidase in strains carrying the rpoS-lacZ fusion listed below the x-axis, and transformed with the control plasmid pLac (blue), or plasmids overexpressing DsrA (green), RprA (yellow), and ArcZ (red). Error bars represent the standard deviation of three independent trials. Strains carrying Δ2-A18-lacZ fusions were compared to the one carrying Δ2-lacZ fusions for their specific activities by unpaired one-tail T-test. Significantly different expression level is marked as * (p < 0.05) or ** (p < 0.01). Expression levels of all the mutants were significantly lower than wt with p < 0.01. (D) sRNA activation of rpoS-lacZ fusions in an hfq− background. Same as in C. Mutant rpoS-lacZ fusions were compared to wt rpoS-lacZ fusion by unpaired one-tail T-test; * (p < 0.05) or ** (p < 0.01).

