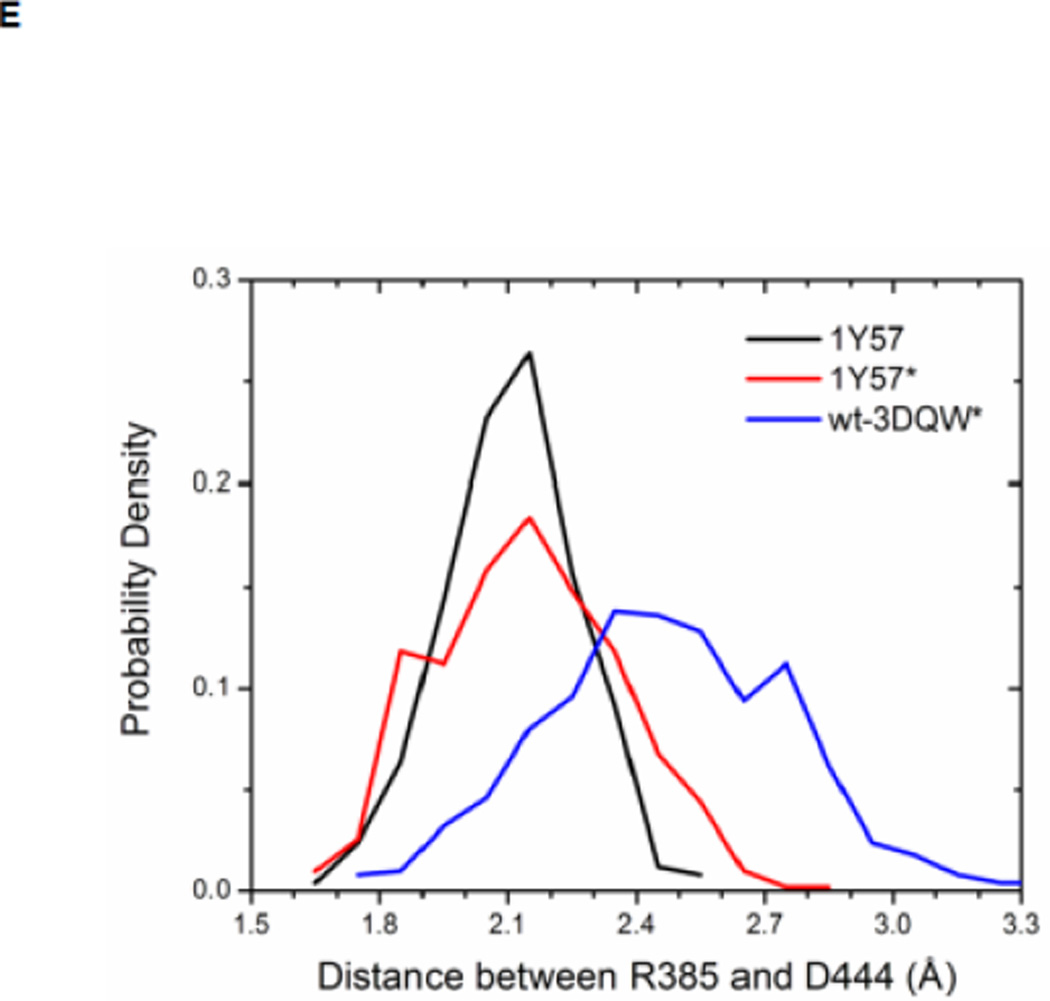
Figure 6.
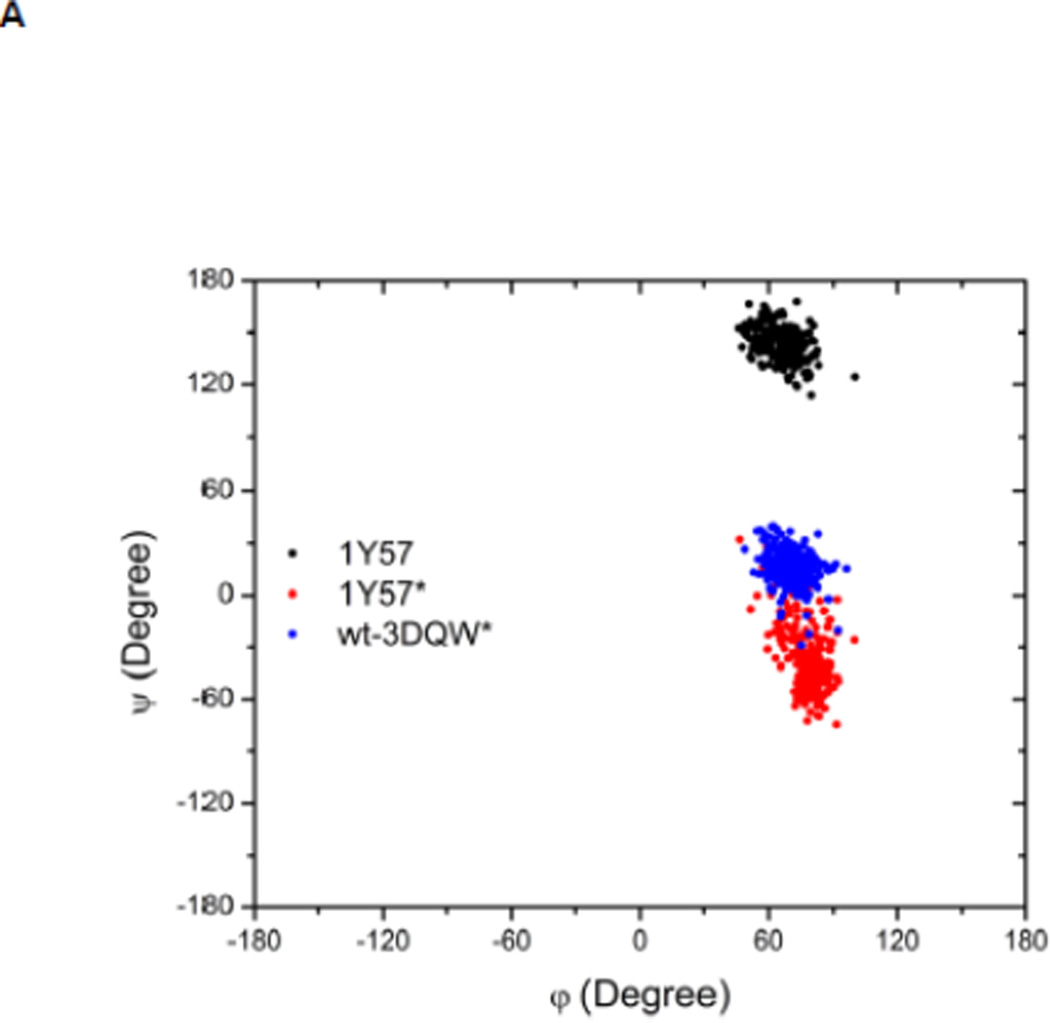
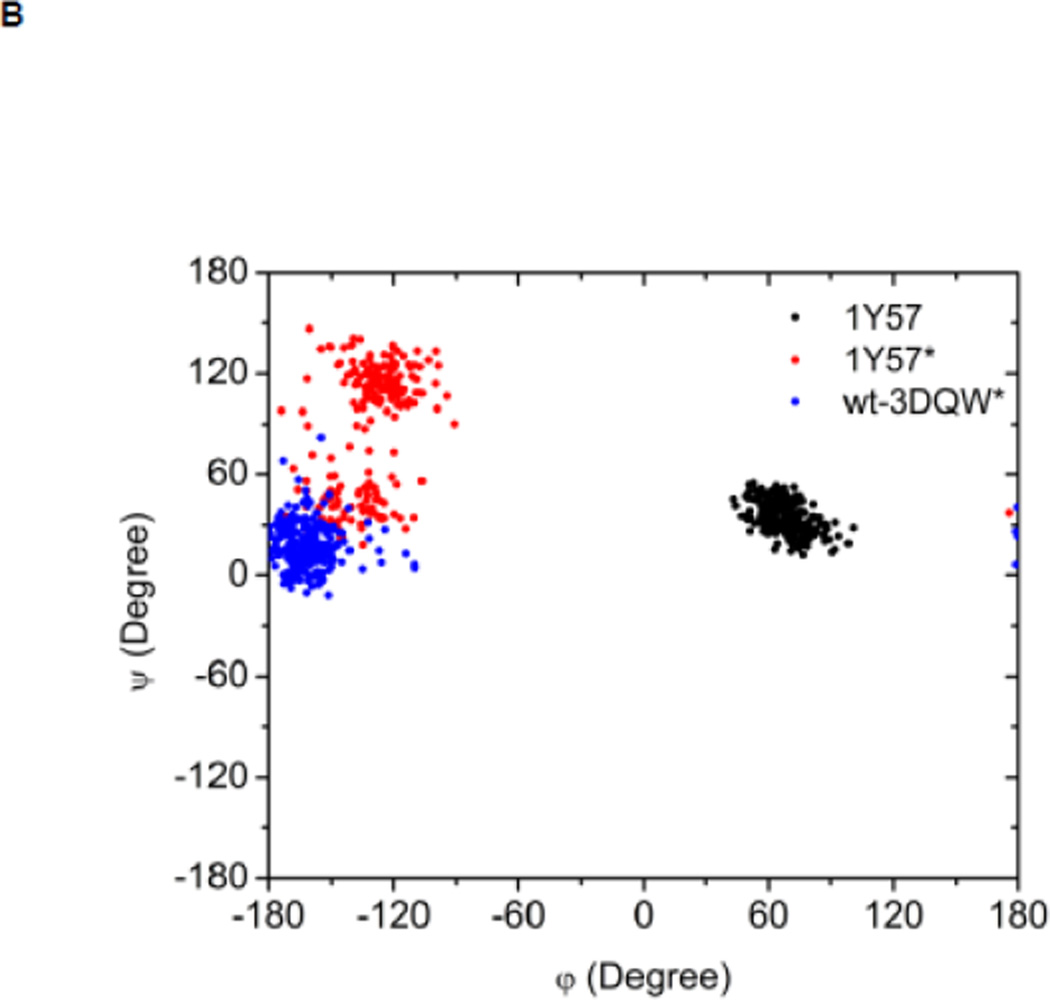
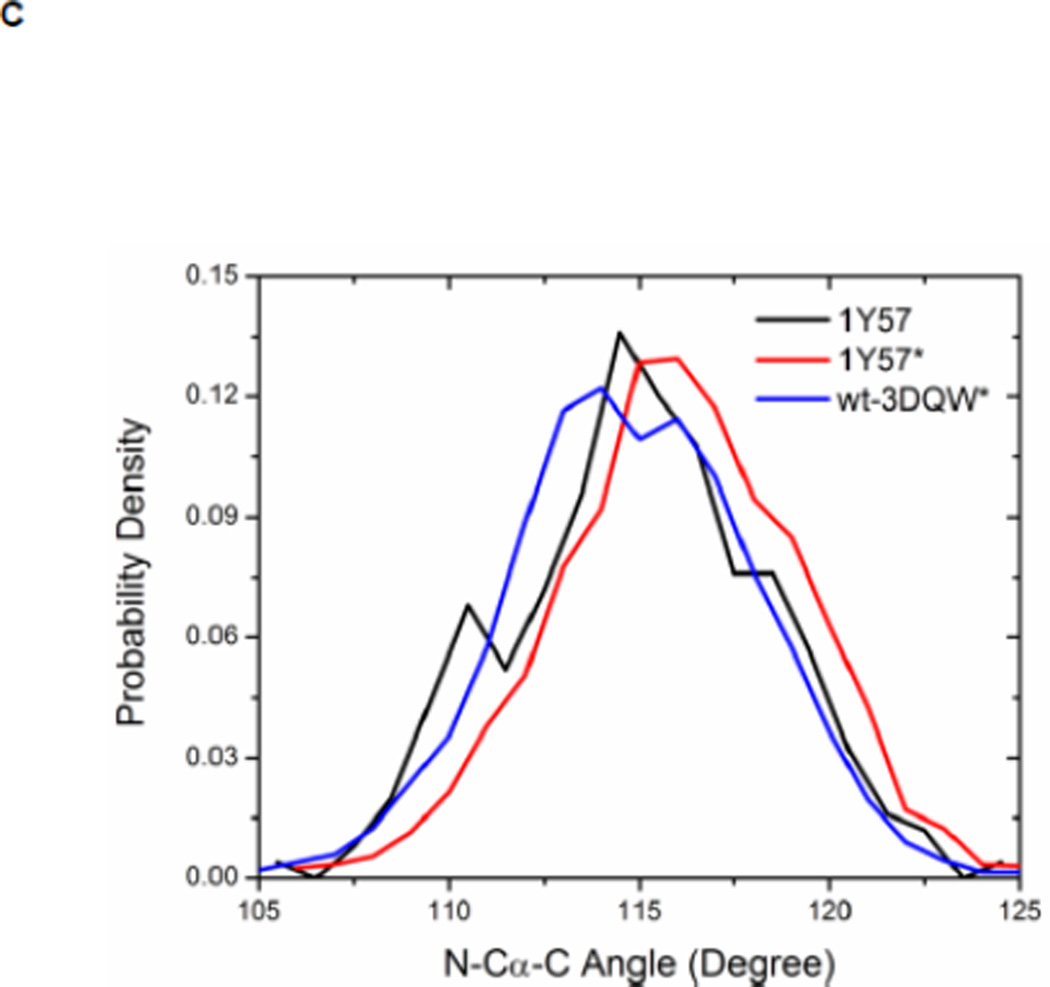
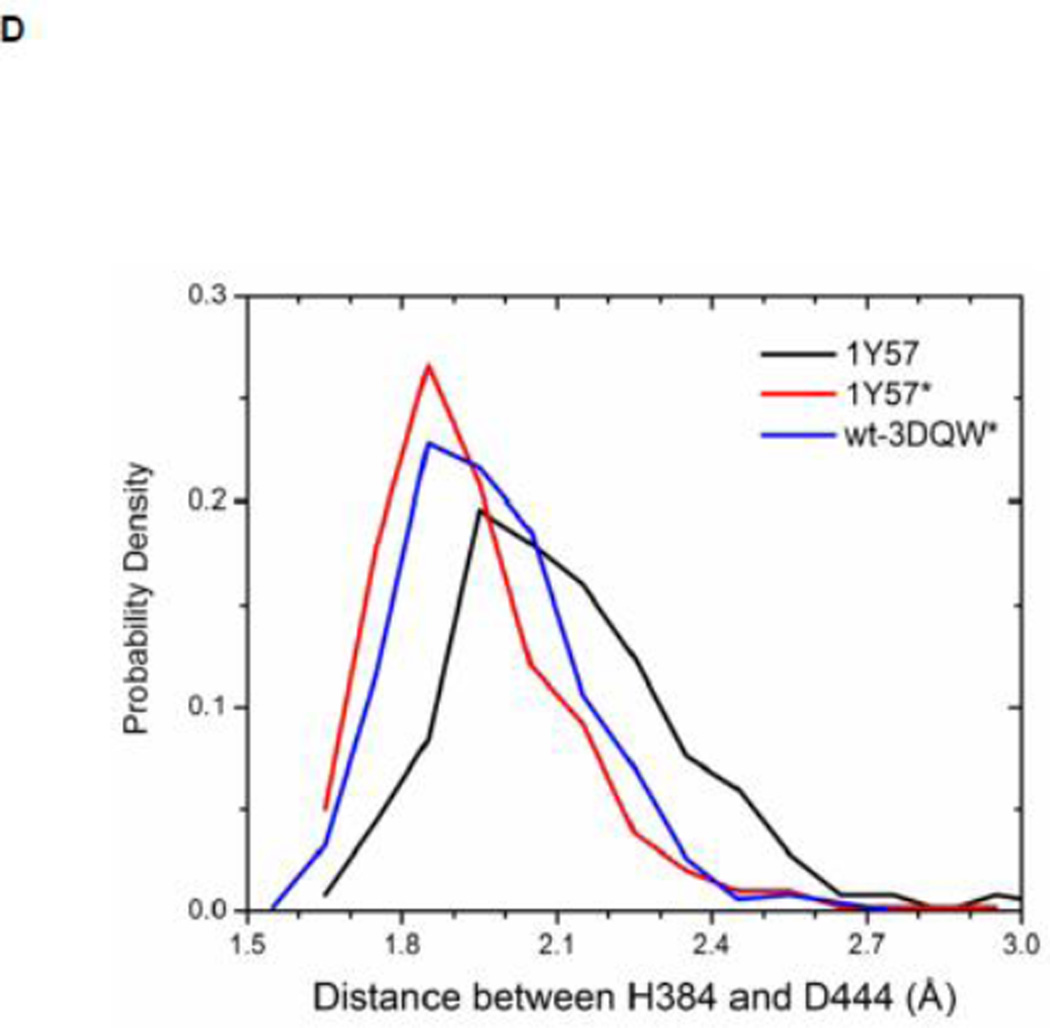
Local conformations of the HRD motif before and after phosphorylation. (A) Scatter plot of backbone φ vs ψ (Ramachandran plot) from R385. (B) Scatter plot of backbone φ vs ψ from D386. (C) Probability density of the backbone bond angle (N-Cα-C) of R385. (D) Probability density of the distance between H384 amide hydrogen atom and D444 side chain oxygen atom. (E) Probability density of the distance between R385 amide hydrogen atom and D444 side chain oxygen atom. Since the two oxygen atoms in the side chain of D444 are equivalent chemically, distances from the hydrogen atom to both oxygen atoms are computed and the smaller one is used to make those probability density plots.

