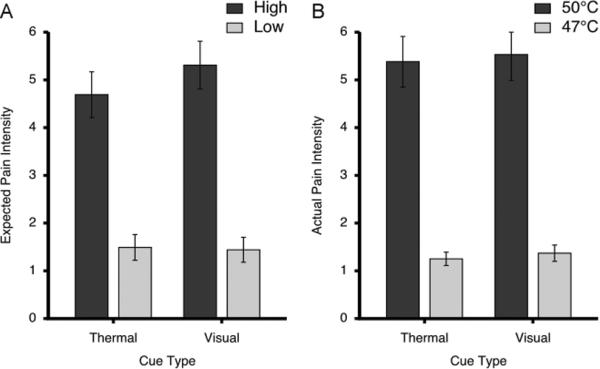
Figure 2.

Expected and actual pain intensity ratings (mean±SEM) following different cue types. After training, ratings of expected pain (A) confirmed that subjects had learned that the high cues signaled intensely painful stimuli whereas low cues signaled mildly painful stimuli. Ratings of actual pain (B) evoked by 50°C and 47°C stimuli were largely consistent with the magnitude of expected pain and were strongly dependent upon stimulus temperature. The visual analogue scales used to provide pain intensity ratings ranged from 0 to 10.
