
Figure 2.
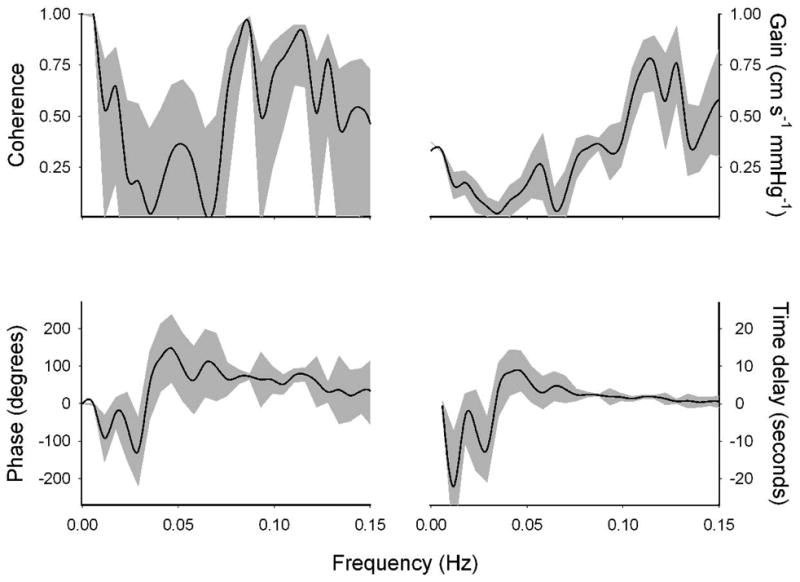
Cross-spectral coherence, gain, and phase relations between arterial pressure and cerebral blood flow fluctuations in one young healthy individual during 15 minutes of -30 mmHg OLBNP at 0.03 Hz. Solid lines show the mean values, and shaded regions show the 95% confidence intervals. Confidence intervals for the gain and phase were calculated based on the mean coherence. Note the relatively wide confidence intervals for coherence and phase at slow fluctuations (< 0.1 Hz; i.e., slower than 10 seconds).