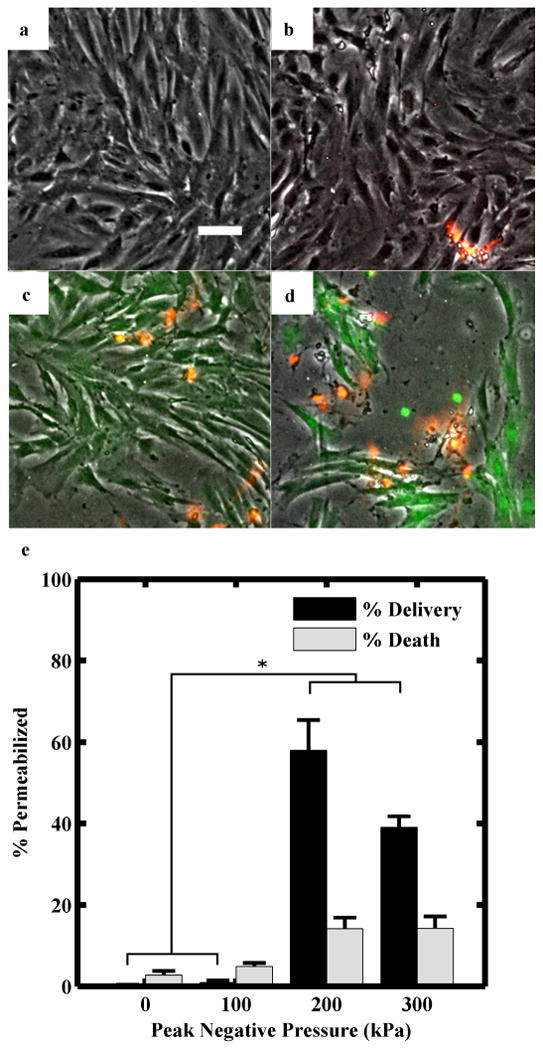
Figure 4.

(a-d) Representative fluorescence microscopy images of rat aortic smooth muscle cells following calcein delivery at peak negative pressures of 0, 100, 200, 300 kPa, respectively. Green fluorescence indicates calcein internalization; orange indicates cell death (scale bar = 50 μm). Flow rate was maintained at 9 mL/s. Microbubbles were 11 μm in diameter, composed of 3 % BSA, 2.5 % GPS, and nitrogen, and produced at a rate of 660,000 MB/s. (e) Calcein delivery and cell death at different ultrasound peak negative pressures. Percentages plotted as mean + one standard deviation, n ≥ 3, * = p < 0.0001.
