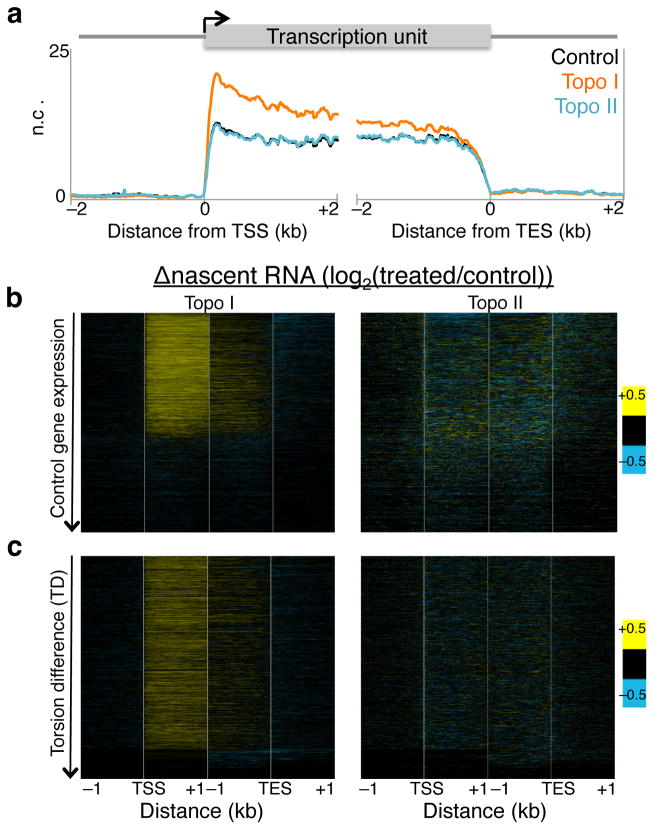
Figure 4. Altered Pol II elongation kinetics upon topoisomerase inhibition.
(a) Nascent RNA-seq was performed on control, Topo I-, and Topo II-inhibited cells, and average profiles were determined for 4 kb surrounding the transcription start site (TSS) and transcription end site (TES) of all genes. A second replicate was performed and analyzed by qPCR (Supplementary Fig. 4c) n.c. Normalized counts. (b) The log-ratio of nascent RNA for Topo I- (left) or II-inhibited (right) samples over control was determined and shown in heat map format with genes ordered by decreasing expression in control samples. (c) Heat maps as in (b) arranged by decreasing TD. Contrast = 0.5.

