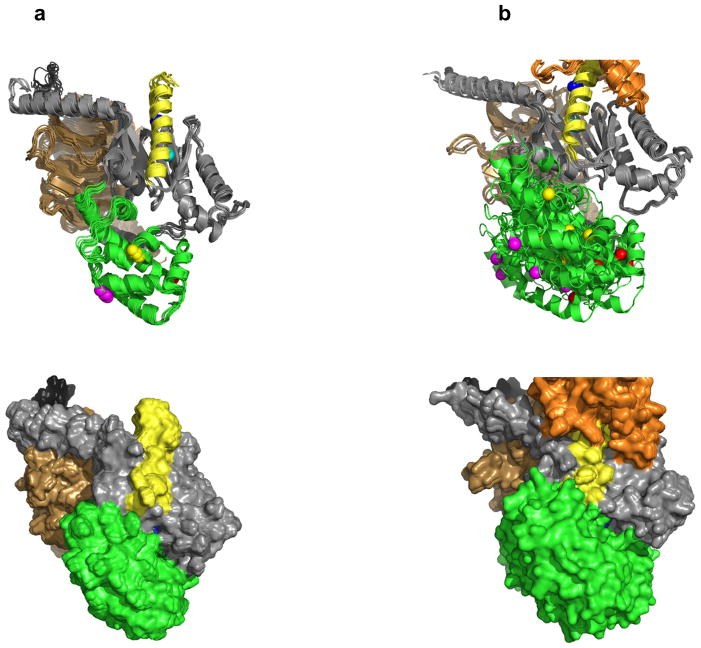
Figure 2.
Placement of helical domain and rotation of α5 as observed by EPR measurements. (a) Gi in the basal state. (b) Gi bound to activated receptor R*. To illustrate motion, landmark residues are colored: L092 (red), E122 (green), D158 (yellow), V335 (cyan), I343 (blue). In both cases we show an ensemble of models that collectively fits the experimental data best. (a bottom, b bottom) Space-filled representations of the helical domain illustrate its positions for the respective states.

