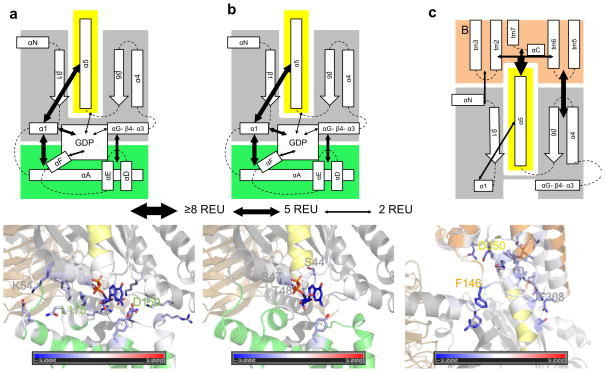
Figure 4.
Rosetta energetic analysis. (a) Analysis of energetics of helical domain|Gαi interface in free Gαi. The thickness of arrows in the top panel corresponds to the strength of the interaction in Rosetta Energy Units (REU, see legend). Residues in the bottom panel are colored by the interaction energy REU from red (repulsive) over white (neutral) to blue (attractive). Residues that contribute more than 0.5 REU are displayed as sticks and the three residues with the largest contributions are labeled. (b) Energetics of the GDP|Gαi interface in free Gαi. (c) Energetics of R*|Gαi interface in the R*-Gαi complex.

