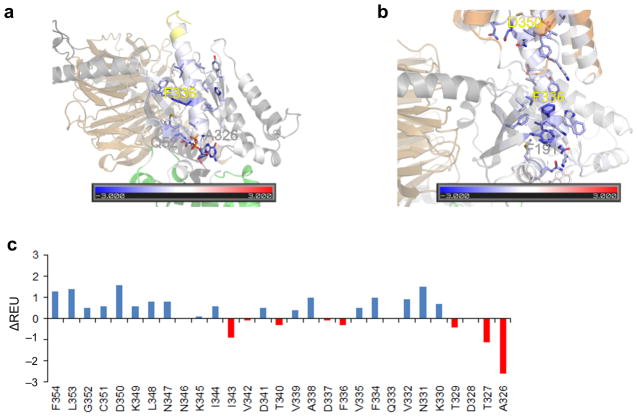
Figure 5.
Rosetta energetic analysis of the interface between α5|Gαi-GTPase. (a) Basal state energetics. (b) Energetics of the R*–Gαi complex. Residues are colored by the interaction energy REU from red (repulsive) over white (neutral) to blue (attractive). Residues that contribute more than 0.5 REU are displayed as sticks and the three residues with the largest contributions are labeled. (c) Energy change (ΔREU) of C-terminal residues (β6–α5 loop and α5 helix) upon receptor binding. A blue color indicates stabilization, a red color indicates destabilization.

