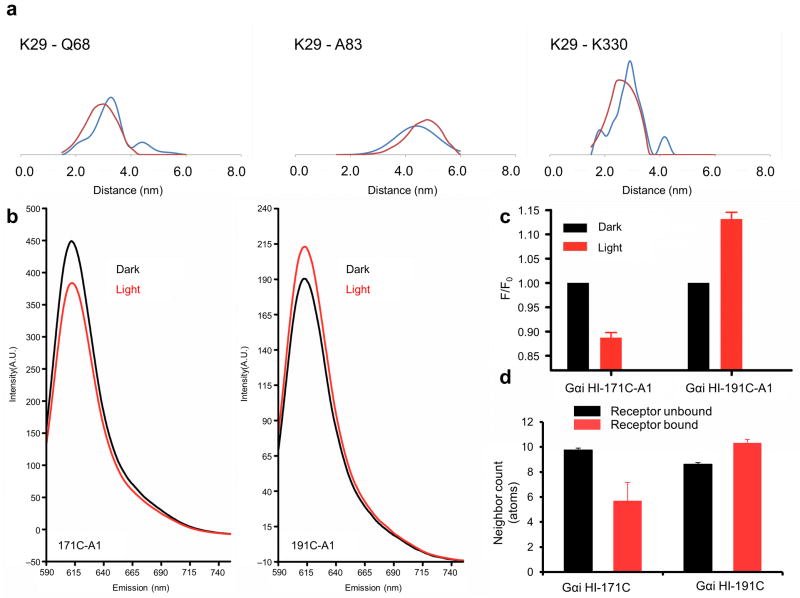
Figure 6.
Agreement of unified model with new structural data. (a) Comparison of the experimental distance distribution as observed in DEER measurements (blue) with the predicted distribution computed from the ensemble mode of the R*–Gi complex (red). (b–d) Comparison of accessibility of residues 171 and 191 in Gαi in the basal (black) and activated state (red). (b) Residues 171 and 191 in a Gαi protein were specifically modified with Alexa-fluor (A1), and emission (Em) was scanned at A1-specific wavelengths. (c) Measured fluorescence of cysteine mutants labeled with a fluorescent probe. Data represent the mean of a minimum of three independent experiments. Error bars show standard error of the mean. (d) Predicted burial as indicated by neighbor count based on the unified model. Bars show mean, and error bars show standard deviation.

