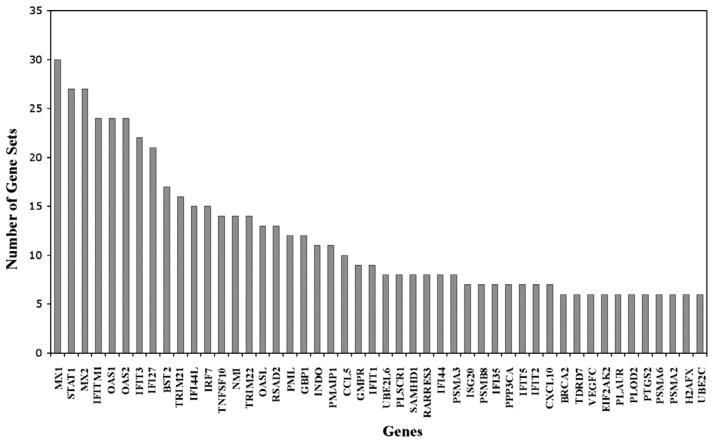
Fig. 7.
GSEA leading edge gene sets analysis. The GSEA analysis selects the genes that appear across multiple enriched gene sets (y-axis) from the public databases. These genes (x-axis) are considered to have higher biological significance. The analysis of our microarray data identified genes highly correlated with interferons, proteasome degradation, caspase pathways, DNA replication, toll-like receptor signaling and neurodegeneration.

