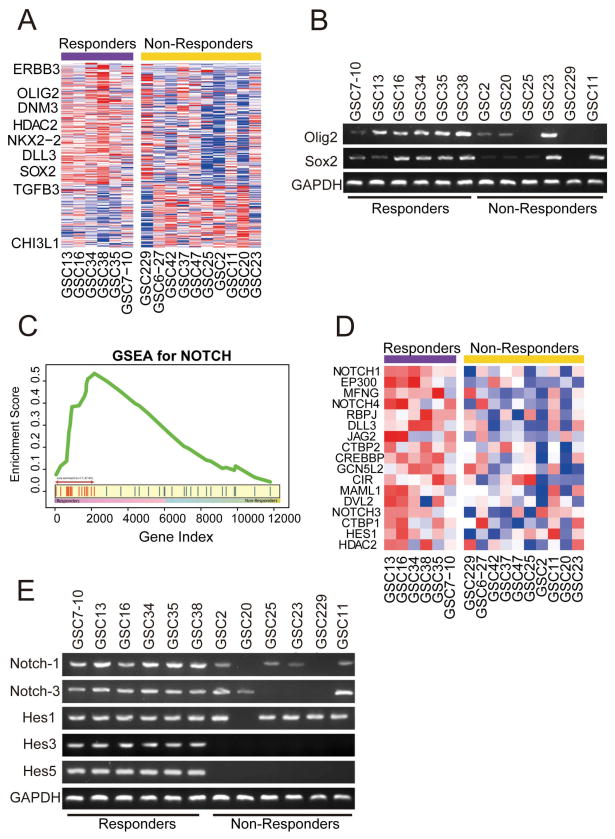
Figure 2. Enrichment of Notch pathway components and proneural signature in responder GICs.
A) Hierarchical cluster analysis on gene expression data from 16 GICs identified several genes highly expressed in the responder group and classified 16 GICs into two major groups with unique gene signatures. The proneural gene signature defined by Verhaak et al was projected to responder and non-responder GICs. (B) RT-PCR validating expression of proneural marker genes Olig2 and Sox2 in responder GICs. (C) Up regulation of Notch pathway in responder cell lines by Gene Set Enrichment Analysis. X-axis represents gene ordered by expression changes between responders and non-responders and Y-axis represents cumulative enrichment score. (D) Expression pattern of NOTCH pathway genes in the GIC microarray data set showing enrichment of Notch pathway components mainly NOTCH1, NOTCH3, HES1, MAML1, JAG2, and DLL3 in responder GICs. (E) RT-PCR data validated expression of the Notch pathway genes Notch1, Notch3, Hes1, Hes3 and Hes5 in the responder GICs.

