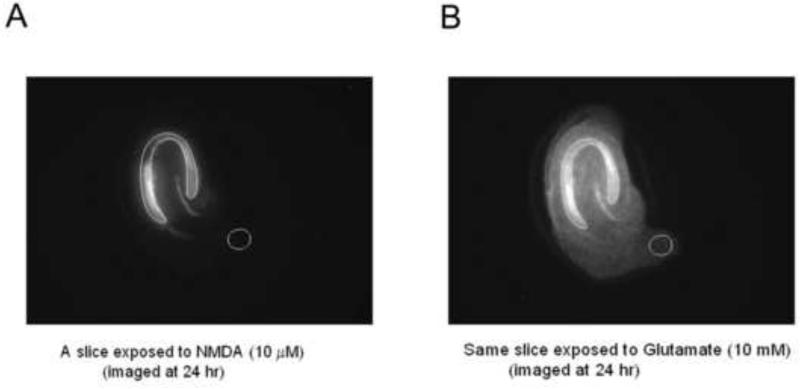
Figure 1.
Analysis of PI fluorescent intensity in the region of interest (ROI) was carried out using Axiovision software. A, B: CA1-CA3 pyramidal cell layer was selected and an outline was drawn in slices showing complete cell death following glutamate treatment. This ROI map was then applied to the image that was obtained following treatment with NMDA alone or NMDA with the test compounds. The reason for selecting the region of interest in the glutamate image first was due to the easy visualization of layers because of maximal cell death, as compared to the NMDA or NMDA+drug image, especially when neuroprotection was robust. The cell death ratio (PI uptake ratio) for each culture was calculated by determining the ratio of the PI intensity in the ROI in the image following treatment to the ROI in the same culture that was subsequently treated with glutamate. Data is thus expressed as % of total cell death.

