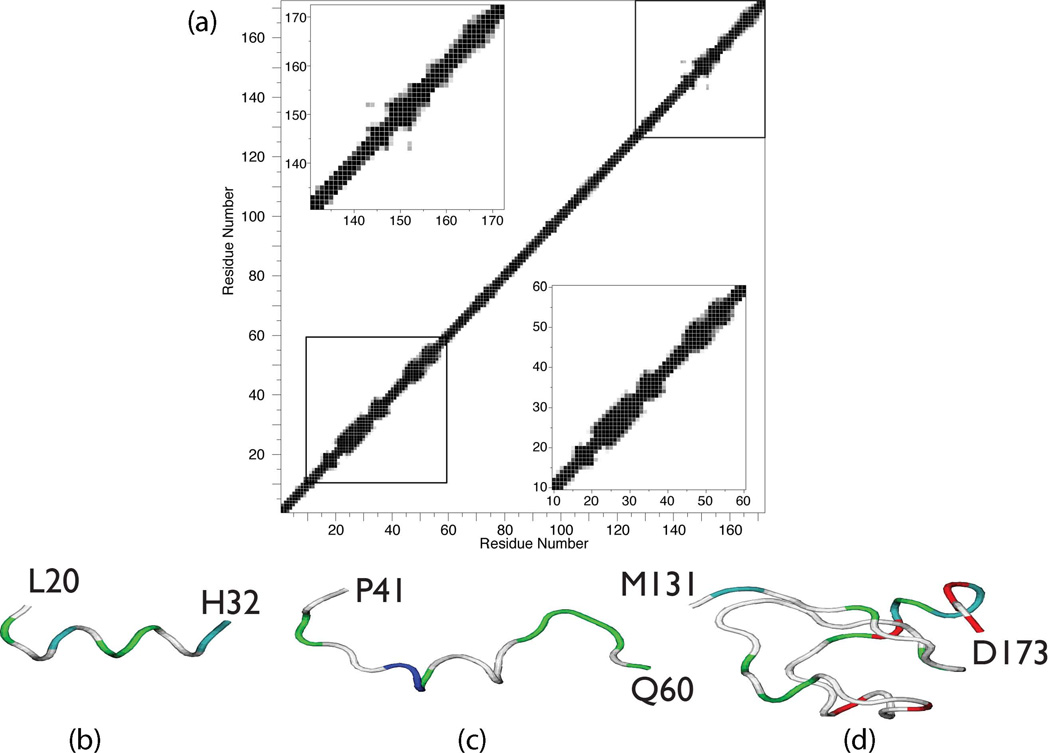
Figure 6.
(a) Contact plot representing the average fraction of structures that have a pair of residues that are in contact, averaged over 20 lowest energy structures of rP172 calculated using CS-ROSETTA. The contact distance between ‘all’ atoms within a pair of residues is below 0.3Å then it is shaded black and if above 0.6Å then shaded white. The contact distance between 0.3 to 0.6Å is shown in different shades of gray. Lower and upper insets show the expanded view of the contact plot for residues between 10 – 60 and 130 – 173, respectively. CS-ROSETTA – generated lowest energy backbone structure for sequence regions of P172 in 100 mM SDS. (b) L20 – H32; (c) P41 – Q60; (d) M131 – D173. Color scheme denotes side chain classification: White = non-polar, Blue = cationic; Green = polar; Red = anionic.

