
Figure 3.
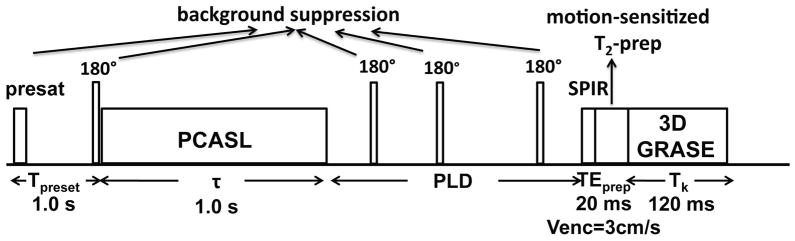
Pulse sequence diagram for 3D mapping of baseline CBF. There are five blocks within each repetition: PCASL (τ = 1 s), background suppression with one preset pulse (Tpresat = 1 s) and four inversion pulses (timing as in Table 1), SPIR pulse, motion-sensitized T2 prep (TEprep = 20 ms), and 3D GRASE acquisition (Tk = 120 ms). Twelve different PLDs ([0.5, 0.7, 0.9, 1.1, 1.3, 1.5, 1.7, 1.9, 2.1, 2.3, 2.5, 2.7] s) were acquired separately for measuring the perfusion kinetic curves.