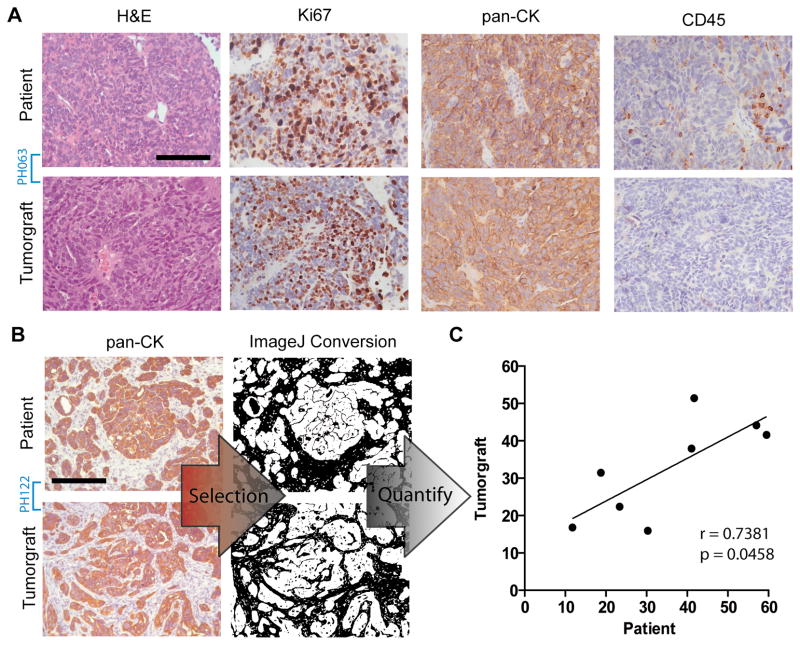
Figure 2.
Histologic similarities between patients and corresponding tumorgrafts. (a) Representative H&E, Ki67, pan-CK, and CD45 expression in tumorgraft model PH063 shows conserved morphology, proliferation index by Ki67, and epithelial phenotype by pan-cytokeratin (40x). Scale bar = 100 μm. (b) Cytokeratin staining in tumorgraft and source patient pathology sections (PH122 shown) were selected and quantified using ImageJ software as described in the Methods section (20x). Scale bar = 200 μm. (c) The calculated non-epithelial tissue for eight tumorgraft models were plotted against that of the source patient.

