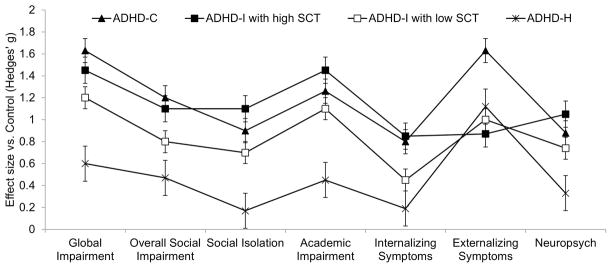
Figure 1.

Point estimates indicate effect sizes (Hedges’ g) for comparisons of each DSM-IV ADHD subtype and the control group without ADHD. The group with ADHD-I was subdivided into groups with (N = 89) and without (N = 144) high SCT based on a cutoff score one standard deviation above the estimated population mean on the SCT composite measure. Error bars indicate the standard error of each effect size.
