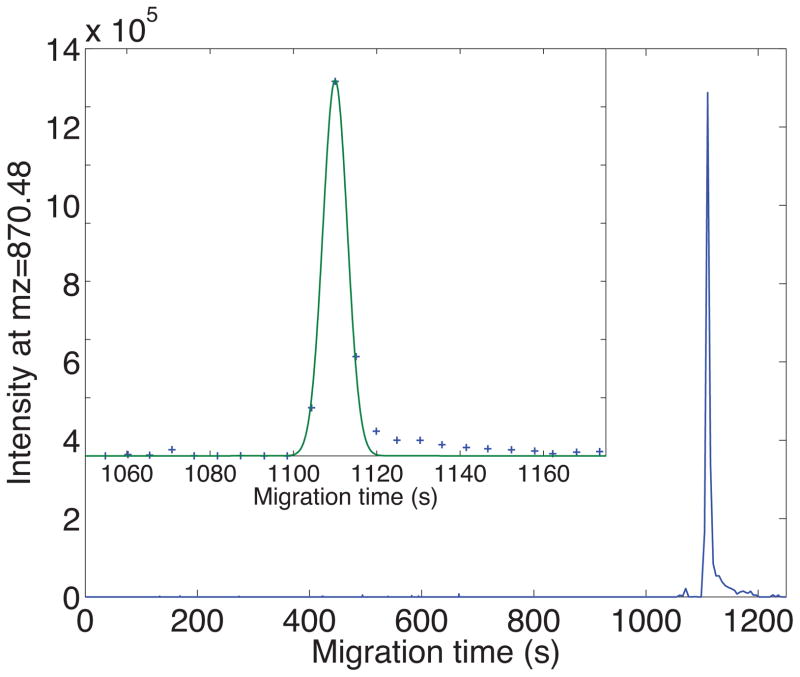
Figure 3.
Parent ion electropherogram of the peptide ILLINPTDSDAVGNAVK using an Orbitrap Velos mass spectrometer. The insert shows the peak in detail. Plus signs are the data and the smooth curve is the least squares fit of a Gaussian function to the peak. Experimental details are provided in ref 21.

