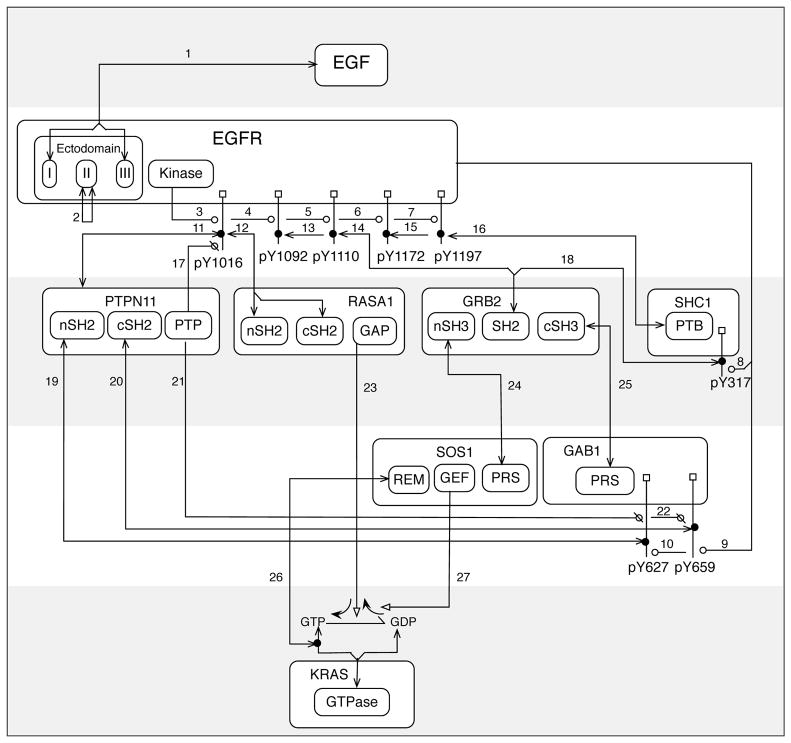
Figure 6.
Example of an extended contact map165 for selected proteins and protein-protein interactions involved in EGFR signaling. The same proteins and interactions are considered in Fig. 1. Boxes with rounded corners represent selected proteins, domains, and linear motifs. Small square boxes attached to vertical lines represent sites of phosphorylation. Lines that begin and end with an arrowhead represent noncovalent direct-binding interactions. Lines that begin at a box representing a catalytic subunit and end with a circle point to substrates of an enzyme (a kinase or phosphatase). An open circle indicates a post-translational modification (phosphorylation); a circle with a line through it indicates reversal of a modification (dephosphorylation). See Table 1 for more information about the interactions represented in this map.

