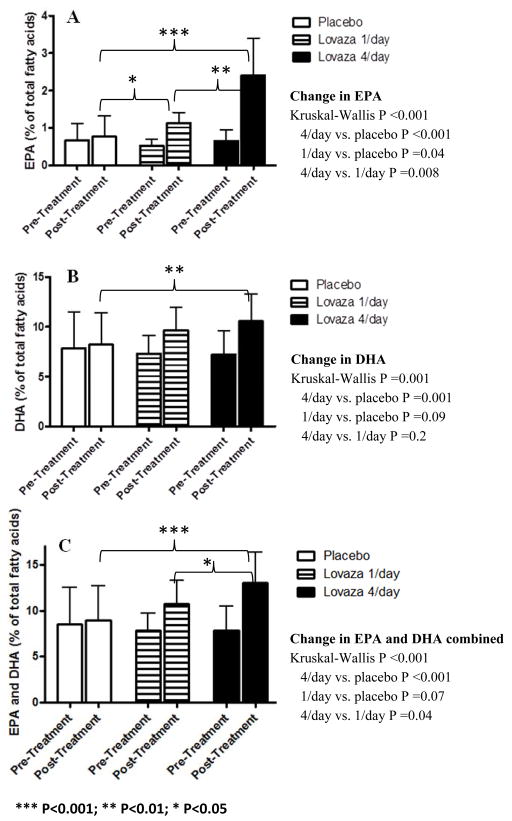
Figure 3. Change in red blood cell membrane fatty acids following EPA+DHA treatment; (A) Eicosapentaenoic acid (EPA), (B) Docosahexaenoic acid (DHA) and (C) combined EPA and DHA.
The proportion of EPA and DHA in the red blood cell membrane increased significantly following EPA+DHA supplementation. Arachidonic acid (AA), EPA and DHA expressed as percentage of total fatty acids measured (AA+EPA+DHA).

