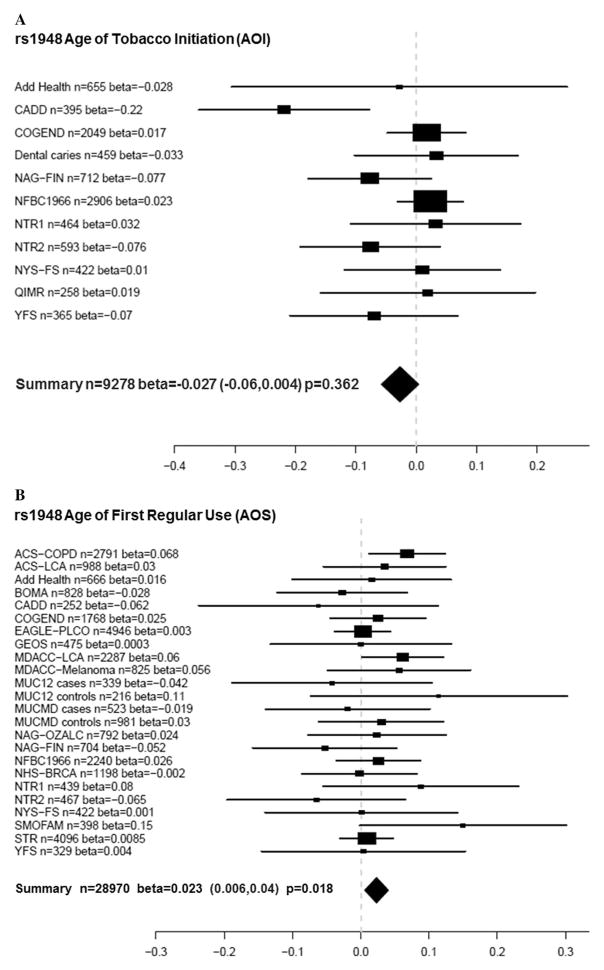
Figure 2.
(A) Meta-analysis forest plot for rs1948 age of tobacco initiation (AOI) showing the individual betas (for each study), summary beta, individual number of subjects (n), summary n, and a summary P-value. Individual and summary betas are for the rs1948 A allele. (B) Meta-analysis forest plot for rs1948 age of first regular tobacco use (AOS) showing the individual betas (for each study), summary beta, individual number of subjects (n), summary n, and a summary P-value. Individual and summary betas are for the rs1948 A allele.

