Figure 2.
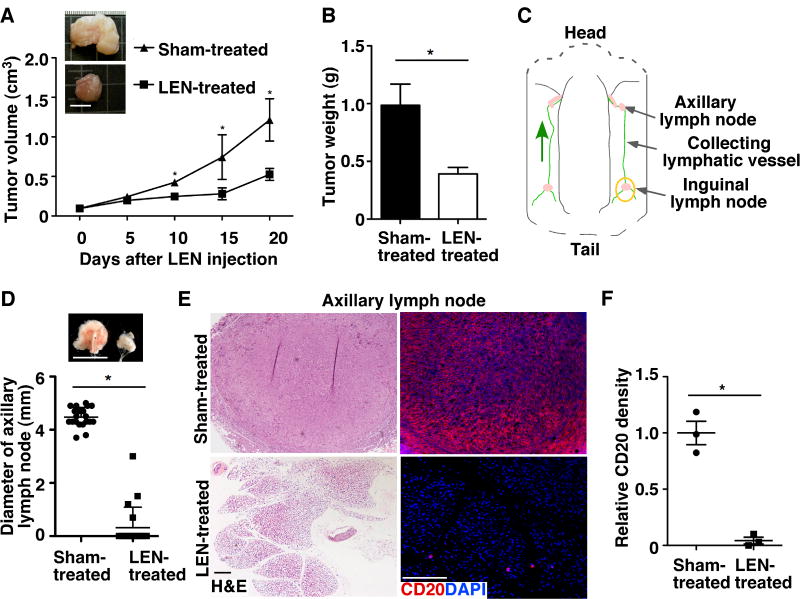
LEN treatment inhibits MCL growth and dissemination. A. The tumor volume of Mino cell–derived MCL mouse xenografts in NSG mice was measured at different times and is presented as the mean ± SEM (n = 10). Scale bar, 10 mm. B. Tumors were weighed at harvest, and data are presented as the mean ± SD (n = 10). C. Schematic diagram showing inguinal lymph node, collecting lymphatic vessel, and axillary lymph node in mouse skin flaps. The yellow circle indicates the site of MCL xenograft. Green arrow shows the direction of lymphatic flow. D. Images and diameters of axillary lymph nodes. Data represent the mean ± SD (n = 10). Scale bar, 5 mm. E. H&E and immunostaining of the human B-cell marker, CD20, in sections of axillary lymph nodes from sham- and LEN-treated mice. Scale bars, 100 μm. F. Quantification of disseminated CD20+ Mino cells in the axillary lymph nodes using ImageJ. The relative staining density was calculated by comparing CD20+ areas per 10× field of LEN-treated samples with those of sham-treated samples. Data represent three independent experiments (Mean ± SEM, n=10, *P < 0.05).

