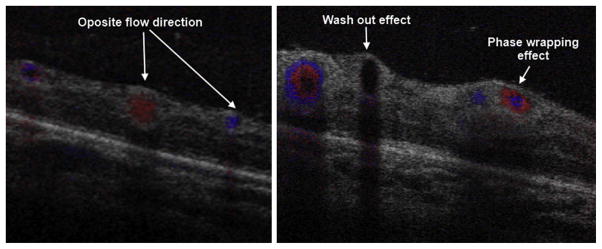
Fig. 10.

SDOCT color Doppler imaging in a 42-week-old PMA infant. The volumetric scan was of 5 × 5 mm, 500 A-scans/B-scan, 40 B-scans and 5 Doppler samples (5 repeated A-scans at each single A-scan point). The B-scans shown were located in zone I across the temporal/superior vascular arcades. (Left) B-scan distal to the optic nerve. Red and blue represent vascular flow in opposite directions with respect to the OCT beam. (Right) B-scan more proximal to the optic nerve. Red and blue rings are produced by increased flow velocity. At higher flow velocities, the Doppler signal disappears, a phenomenon known as washout effect.
