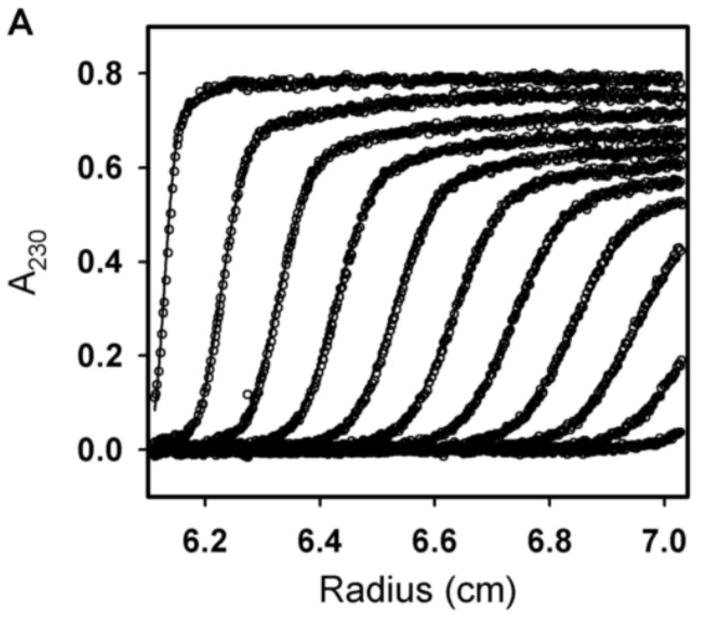
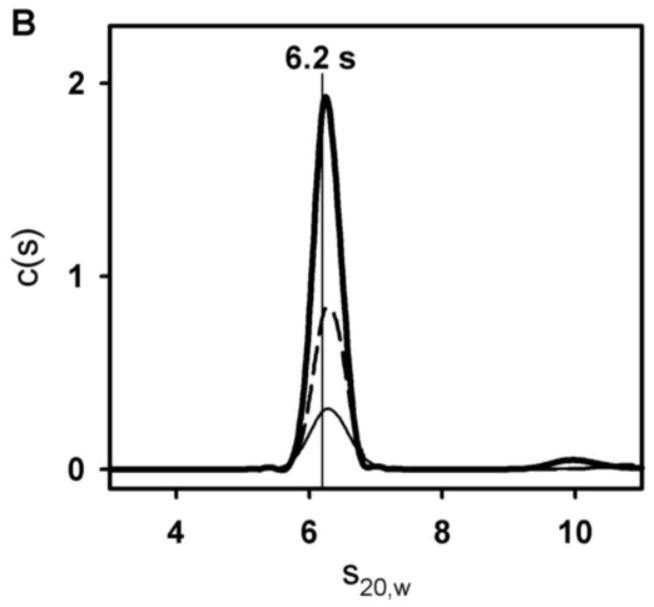
Figure 4. Sedimentation velocity analysis of GR/ER at 100 mM NaCl, pH 8.0 and 4°C.
(A) Sedimentation velocity data and fit of 2 μM GR/ER at 100 mM NaCl, pH 8.0 and 4°C. Only every fourth scan is shown for clarity. (B) Sedfit [18] c(s) analysis of 2 (thick solid line), 1 (dashed line) and 0.5 (thin solid line) μM GR/ER sedimentation velocity data. As indicated by vertical line, position of major peak is 6.2 s.


