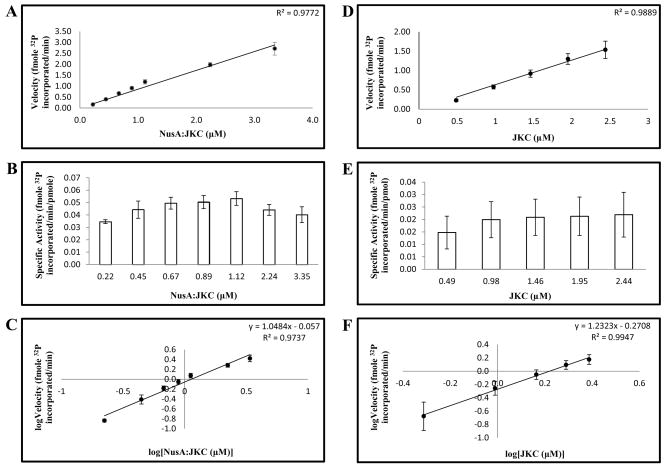
Figure 6.
ACR4 autophosphorylates via an intramolecular mechanism. NusA:JKC (A–C) and JKC (D–F) were incubated at increasing enzyme concentrations in an autophosphorylation assay. (A and D) Plot of velocity vs. enzyme concentration. (B and E) Plot of specific activity vs. enzyme concentration. (C and F) van’t Hoff plot of the logarithm of enzyme velocity vs. the logarithm of enzyme concentration. Linear regression of the data in C and F estimates a slope of 1.05 for NusA:JKC and a slope of 1.23 for JKC. In A-F, data are the mean ± S.E (n = 4).

