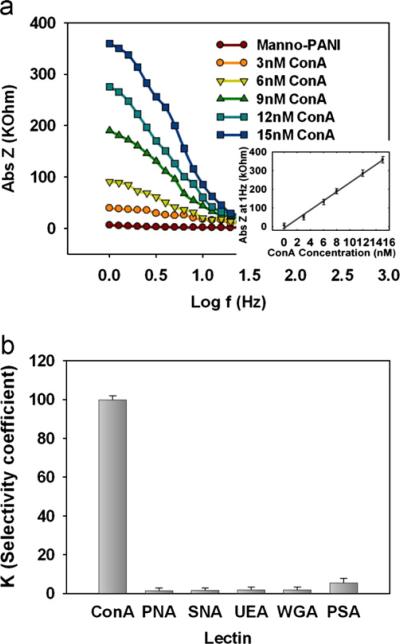
Fig. 5.
Quantification of manno-PANI and lectin interactions by electrochemical techniques for sensor application (a) EIS spectrum of manno-PANI film in the absence and presence of Con A at different concentrations Insert: Plot of impedance at 1 Hz vs. Con A concentration. (b) Comparison of the selectivity coefficients (K) for control lectins with respect to Con A at the same concentration (6 nM), where ΔZ is the difference of impedance of the manno-PANI film before and after the addition of a lectin and K=ΔZ (control lectin)/ΔZ (Con A).

