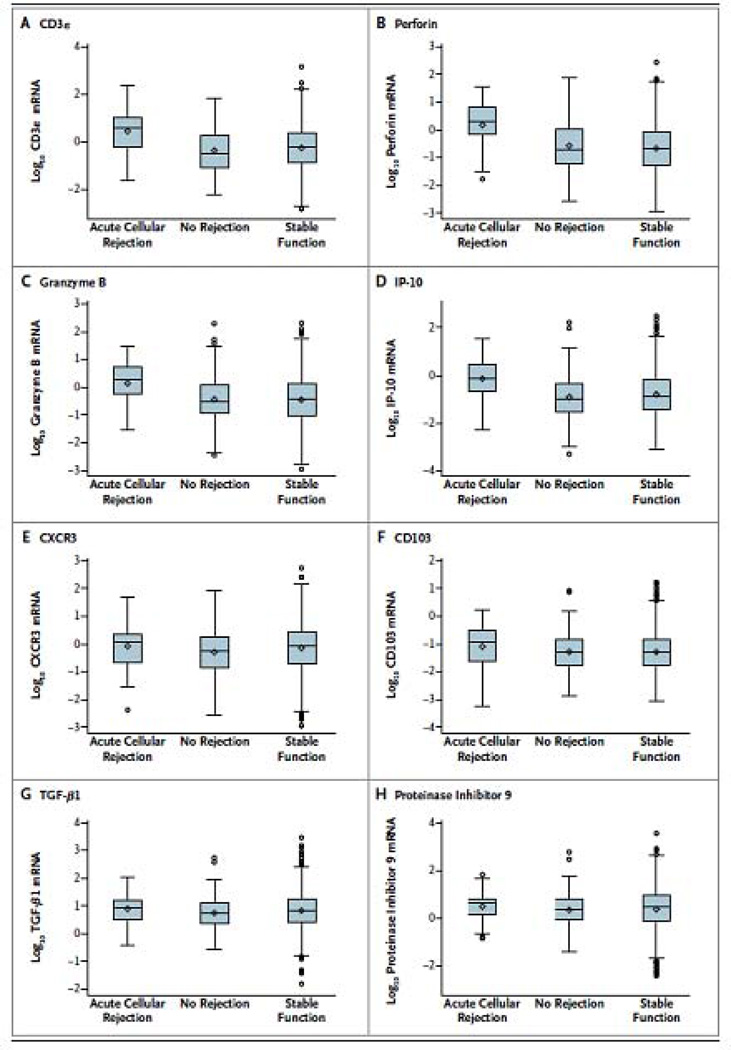
Fig. 3. Levels of mRNA in urinary cells.
Box-and-whisker plots show the log10-transformed ratios of mRNA copies per microgram of total RNA to 18S ribosomal RNA (rRNA) copies (X10−6) per microgram of total RNA for CD3ε, perforin, granzyme B, interferon-inducible protein 10 (IP-10), CXCR3, CD103, transforming growth factor β1 (TGF-β1), and proteinase inhibitor 9 in 43 urine samples matched to 43 biopsy specimens (from 34 patients) showing acute cellular rejection, 163 urine samples matched to 163 biopsy specimens (from 126 patients) showing no rejection, and 1540 longitudinally collected urine samples from 201 patients with stable graft function who did not undergo biopsy. The horizontal line within each box represents the median, the bottom and top of each box represent the 25th and 75th percentile values, and the thin vertical bars extend to the 10th and 90th percentile values; the diamond indicates the mean, and circles indicate outliers. The mRNA levels of CD3ε, perforin, granzyme B, and IP-10 differed significantly among the three groups (P<0.001 for all comparisons), but not the levels of CXCR3 (P = 0.06), CD103 (P = 0.13), TGF-β1 (P = 0.11), and proteinase inhibitor 9 (P = 0.38). P values are based on the Kruskal–Wallis test, with the log10-transformed, 18S-normalized mRNA levels treated as the dependent variable. Pairwise group comparisons by means of the Mann–Whitney test showed that the 18S-normalized mRNA levels for CD3ε, perforin, granzyme B, and IP-10 in patients with acute cellular rejection were significantly higher than the levels in those with specimens showing no rejection (P<0.001 for each mRNA) and in those with stable graft function (P<0.001 for each mRNA) (from Suthanthiran et al. N Engl J Med 2013, with permission).

