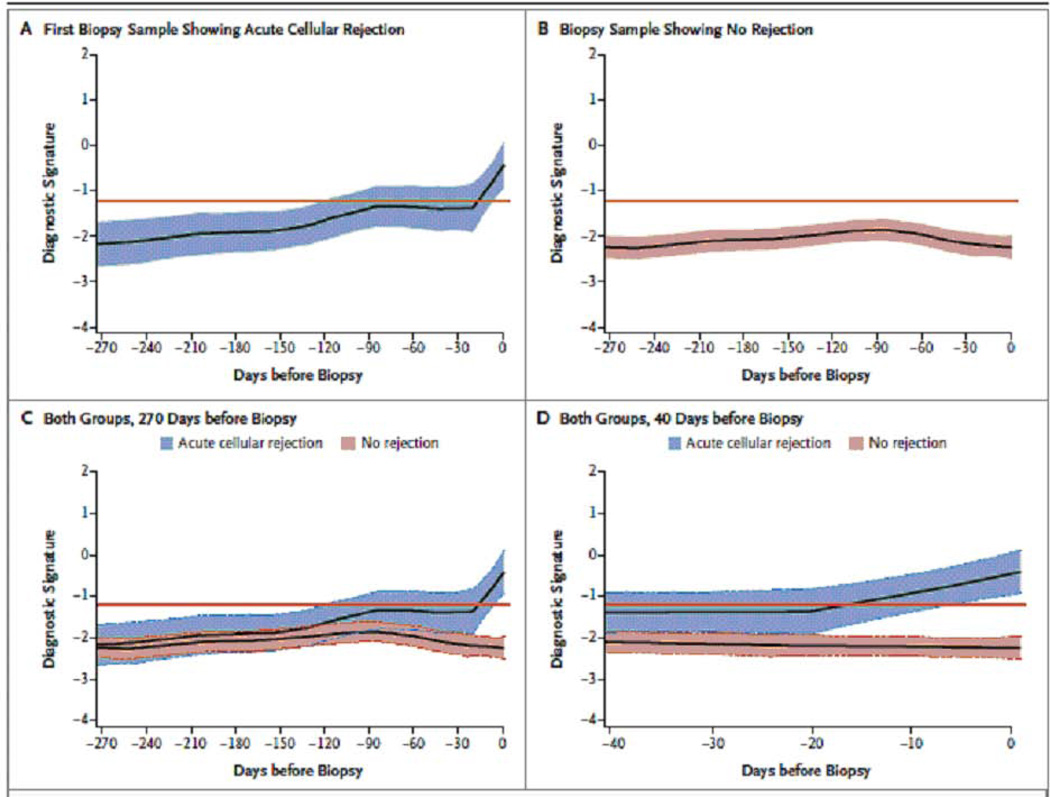
Fig. 6. Retrospective trajectory of diagnostic signature as a function of time prior to biopsy.
The average within-person retrospective trajectory of the diagnostic signature (i.e., the trajectory as a function of the time before biopsy) in urine samples obtained at or before biopsy that passed quality control are shown for the group of 38 patients with first biopsy specimens showing acute cellular rejection (201 urine samples) (Panel A) and the group of 113 patients with specimens showing no rejection (833 urine samples) (Panel B). Only specimens obtained during the first 400 days after transplantation were included. The diagnostic signature remained relatively flat and well below the −1.213 threshold that was diagnostic of acute cellular rejection during the 270 days before biopsy in the group of patients with findings showing no rejection (Panel C). There was a significant difference in the trajectories between the two groups, with a marked increase in the diagnostic signature during the 20-day period before the first specimen showing acute cellular rejection (P<0.001) (Panel D). The y-axis values are diagnostic-signature scores without intrinsic units of measurement; they were calculated from the logistic-regression equation (−6.1487 + 0.8534 log10[CD3ε/18S] + 0.6376 log10[IP-10/18S] + 1.6464 log10[18S]). Absolute levels of CD3ε mRNA, IP-10 mRNA, and 18S rRNA in the cells from each urine sample were measured by polymerase-chain-reaction assay, with the units of measurement being copies per microgram of total RNA for each mRNA measure and copies (×10-6) per microgram of total RNA for 18S rRNA. The mRNA copy numbers were 18S-normalized by dividing the mRNA copy number by the 18S rRNA copy number in the same sample, and the ratio was log10-transformed. In all the panels, the black lines indicate the trajectory, the colored bands the 95% confidence interval, and the red lines the diagnostic threshold (from Suthanthiran et al. N Engl J Med 2013, with permission).

