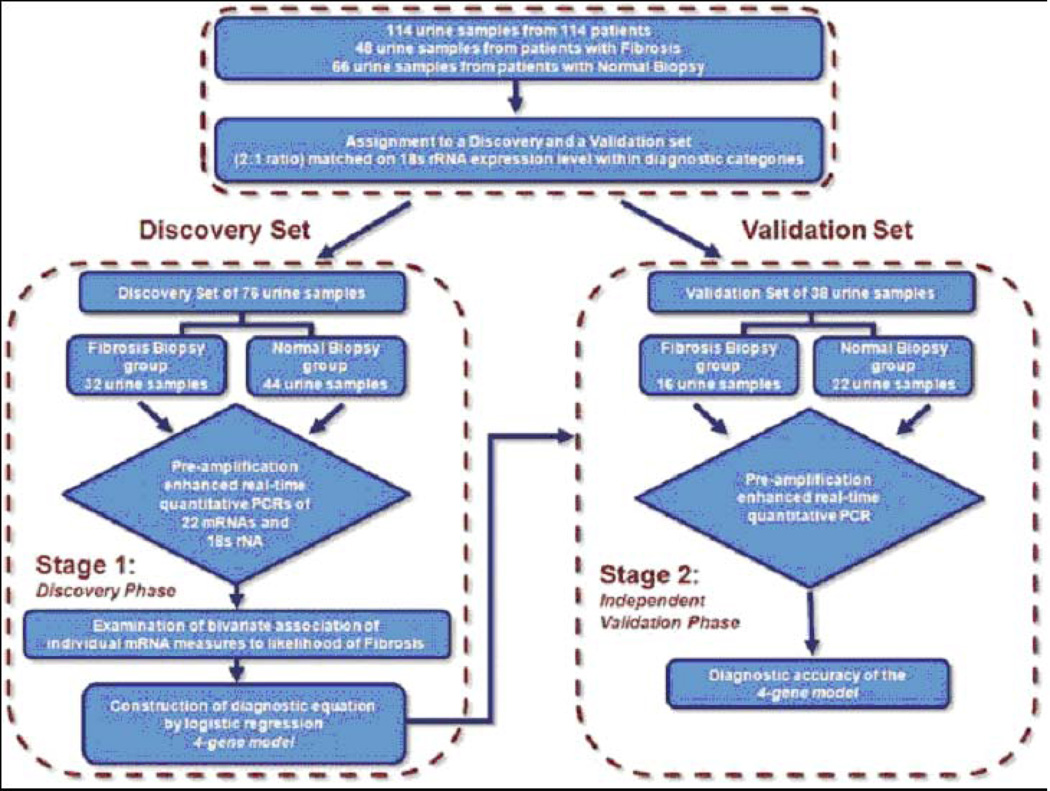
Fig. 7. Flow chart for the discovery and validation of urinary cell mRNA profiles.
The 114 kidney allograft recipients (48 with biopsies showing fibrosis and 66 with normal biopsy results) were rank ordered within group (Fibrosis group or Normal Biopsy group) by the copy number of 18S rRNA and partitioned into triplets. Within each triplet, the first and third patients were assigned to the Discovery set and the second patient was assigned to the Validation set, resulting in the two sets being exactly matched on fibrosis status and very closely matched on 18S rRNA copy number. Twice as many patients were assigned to the Discovery set in order to enhance statistical power for the exploratory analyses, which included a procedure to protect against the risk of a Type I error (from Anglicheau et al. Transplantation 2012, with permission).

