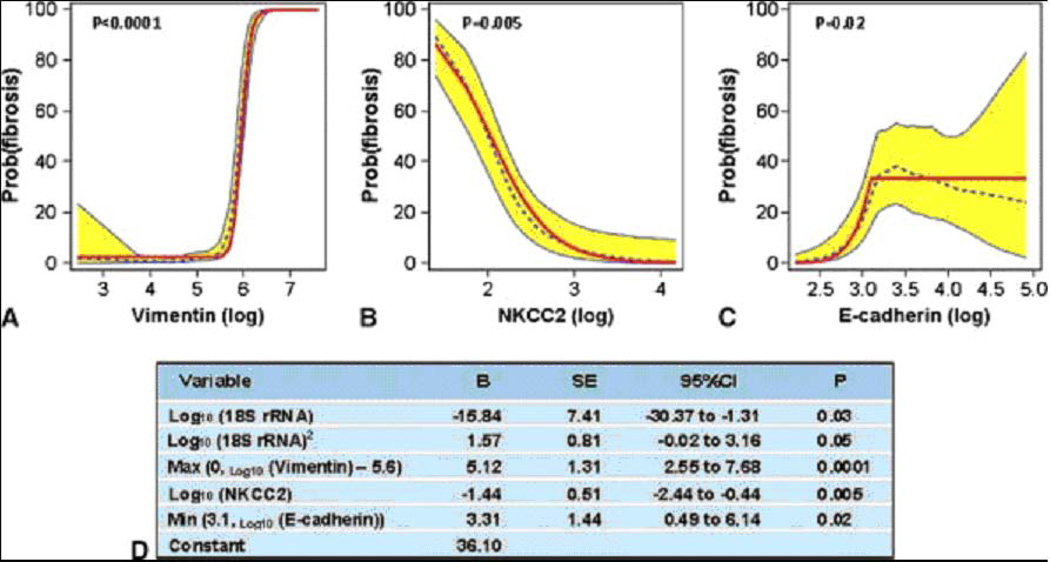
Fig. 9. Final model derived from the discovery set for the diagnosis of fibrosis.
The predicted probability of fibrosis (y-axis) as a function of individual log10-transformed messenger RNA (mRNA) copy numbers (x-axis) for vimentin (Panel A), NKCC2 (Panel B), and E-cadherin (Panel C) after controlling for the copy numbers for the other two mRNAs and 18S rRNA is shown. Each plot shows the locally weighted scatterplot smoothing (LOESS) model’s predicted probabilities (dotted line), their 95% confidence interval (CI) (shaded area), and the logistic regression model’s predicted probabilities (solid line). The parameter estimates for the four-gene model including terms accounting for the relationships, including nonlinear relationships, between the mRNAs and diagnosis are provided in Panel D (from Anglicheau et al. Transplantation 2012, with permission).

