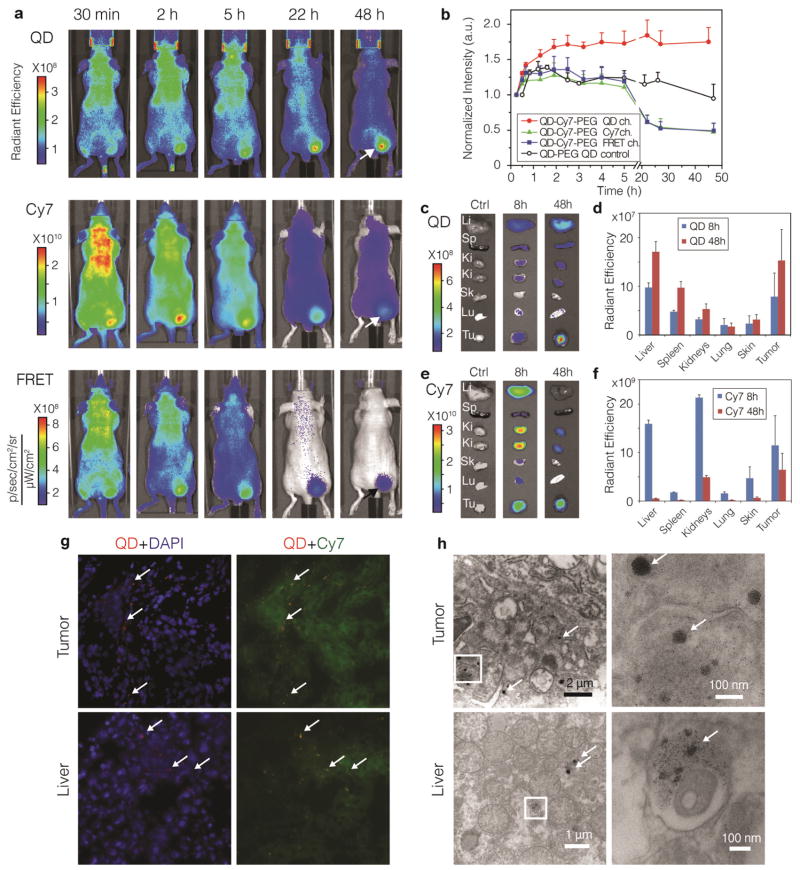
Figure 2. Accumulation and dissociation of QD710-Cy7-PEG in xenograft tumor mouse model upon intravenous administration.
a, Representative in vivo NIR fluorescence images of a tumor bearing mouse injected with 100 pmol/g FRET particles QD710-Cy7-PEG at 30 min, and 2, 5, 22, and 48 h post-injection. Tumor mice injected with 100 pmol/g QD710-PEG nanoparticles containing no Cy7-lipids were used as QD control. Fluorescent signal was collected using three optical filters settings: QD (λExc = 605 ± 18 nm, λEm = 720 ± 10 nm), Cy7 (λExc =745± 18 nm, λEm = 800 ± 10 nm) and FRET (λExc= 605± 18 nm, λEm= 800 ± 10 nm). b. The mean intensities (n=5 mice per group) from the tumor area (indicatad with arrows in a) plotted against post-injection time. QD, Cy7 and FRET intensities were from mice injected with QD710-Cy7-PEG, and QD control were from mice injected with QD710-PEG. Mice were sacrificed at 8 h (n = 3) and 48 h (n = 5) after injection and major organs were subjected to ex vivo fluorescence imaging. Representative images and mean intensities from the organs are presented in c and d for the QD channel and in e and f for the Cy7 channel. Li, liver; Sp, spleen; Ki, kidney; Sk, skin; Lu, lung; Tu, tumor. g, Fluorescence microscopy images of frozen sections of tumor (upper row) and liver (lower row) tissue sections at 48 h post-injection. Signal from QD (λExc = 620 ± 30 nm, λEm= 700 ± 35 nm) is red, DAPI for nucleus staining (λExc = 350 ± 30 nm, λEm= 460 ± 22 nm) is blue and Cy7 (λExc =710 ± 35 nm, λEm= 810 ± 40 nm) is green. Aggregates of QD cores are indicated by arrows. h, Stained transmission electron microscopy (TEM) images of tumor (upper row) and liver (lower row) tissues at 48 h after injection. Insets are magnified on the right. Aggregates of QD cores are indicated by arrows.

