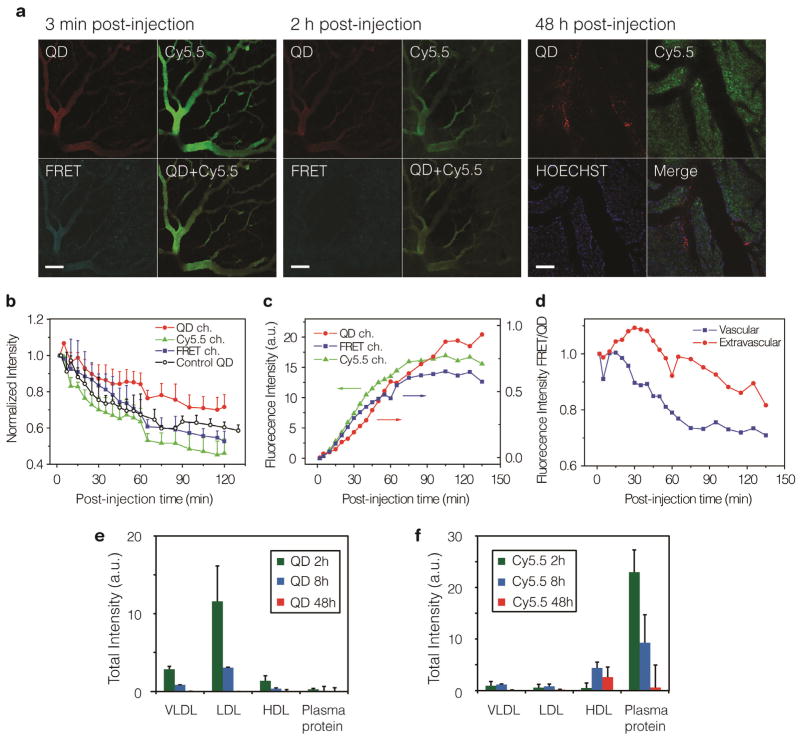
Figure 3. Intravital microscopy of tumors grown in a window chamber and FPLC investigation of the dynamics of lipid-coated nanocrystal.
a, Mice with tumor grown in a window chamber were injected with 130 pmol/g QD610-Cy5.5-PEG and continuously observed for 2 h, and discretely observed until 48 h post administration. Representative fluorescence images at 30 min, 2 h and 48 h are shown in a. The scale bar represents 100 μm. Four optical channels were used: QD (λExc = 488 nm, λEm= 612–655 nm) is shown in red, Cy5.5 (λExc = 633 nm, λEm= 698–719 nm) is shown in green, FRET (λExc = 488 nm, λEm= 698–719 nm) in cyan and HOECHST for nucleus staining (λExc = 780 nm, λEm= 435–485 nm) in blue. The normalized fluorescence intensities in three channels (QD in filled circles, Cy5.5 in filled triangles and FRET in filled square) are plotted against post-injection time for the vascular in b, and for extravascular space in c. QD610-PEG nanoparticles containing non Cy5.5-lipids were used as QD control (empty circles). d, The FRET/QD intensity ratios derived from the graphs in b, c represent the relative extent of FRET per QD and are plotted against time. Plasma collected from mice at 2 h, 8 h and 48 h after injected with 100 pm/g QD-Cy5.5-PEG (n=3 animals for each time point) separated in different fractions using fast protein liquid chromatography (FPLC). The total fluorescent intensities from four different protein fractions: VLDL (25–90 nm), LDL (18–25 nm), HDL (5–15 nm) and small plasma proteins (< 5 nm) are summarized in e, for QD signal (λExc = 430 ± 18 nm, λEm= 620 ± 10 nm), and in f, for Cy5.5 signal (λExc = 640 ± 18 nm, λEm= 700 ± 10 nm).

