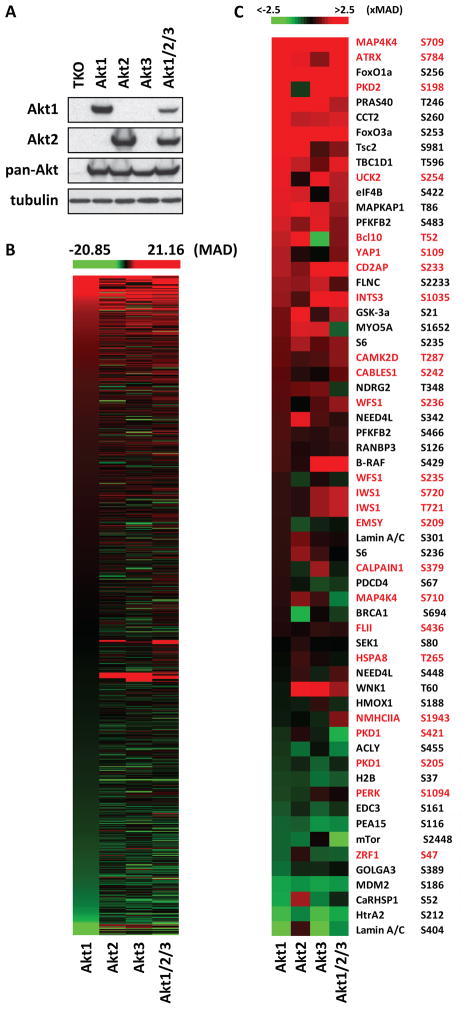
Figure 1. The phosphoproteomes of Akt1, Akt2, Akt3 and Akt1/2/3-expressing cells.
(A) Western blots of cell lysates of Akt-null (TKO) lung fibroblasts and their Akt isoform-expressing derivatives were probed with the indicated antibodies.
(B) Heat map of the relative abundance of all the phosphorylation events detected in the phosphoproteomics screen. The relative abundance of each phosphorylation event is presented as the robust z-score of the ratio Akt1/TKO, Akt2/TKO, Akt3/TKO or Akt1/2/3/TKO.
(C) Heat map of the abundance of phosphorylation of known Akt substrates (black) and Akt substrates that were identified in this screen (red). The phosphorylated residue is shown on the right.

