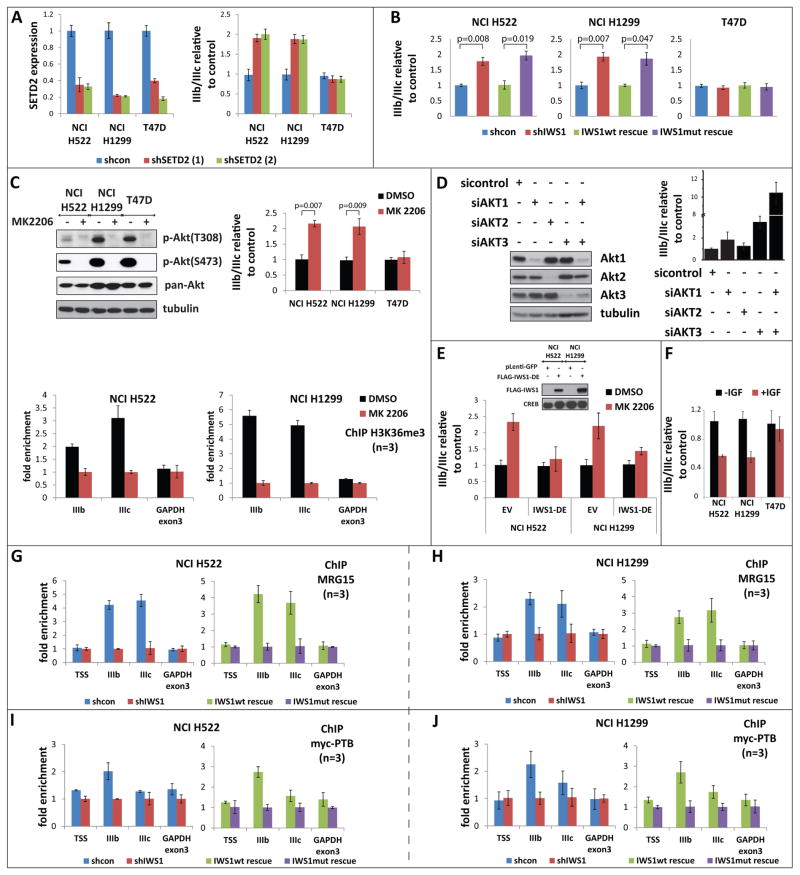
Figure 4. IWS1 phosphorylation at Ser720/Thr721 by Akt3 and Akt1 regulates the alternative splicing of the FGFR-2 gene.
(A) The SETD2 knockdown shifts the IIIb/IIIc ratio of the FGFR-2 mRNA toward the IIIb isoform. (Left) Real time RT-PCR for SETD2 in the indicated cell lines transduced with two different shSetD2 constructs or with an shControl construct. (Right). Real time RT-PCR showing the IIIb/IIIc FGFR-2 mRNA ratios in the cells on the left panel. Bars show the mean SETD2 levels or the mean IIIb/IIIc ratios in shSetD2, relative to shControl cells ± SD.
(B) IWS1 phosphorylation regulates FGFR-2 alternative splicing. Real time RT-PCR showing the IIIb/IIIc FGFR-2 ratios in the indicated shControl, shIWS1, shIWS1/wt rescue and shIWS1/mutant rescue cells. Bars show the mean IIIb/IIIc ratio in shIWS1, shIWS1/wt rescue and shIWS1/mutant rescue cells, relative to shControl cells ± SD.
(C) Akt inhibition interferes with histone H3K36 trimethylation in the FGFR-2 gene and promotes inclusion of the IIIb exon in the transcript. (Top) Left: Lysates of the indicated cells, harvested before and after a 2 hour treatment with MK2206 (5 μM) or DMSO, were probed with antibodies, as shown. Right: The FGFR-2 IIIb to IIIc ratio was measured by quantitative RT-PCR. Bars show the ratio in cells treated with MK2206 relative to cells treated with DMSO (mean ± SD). P-values were calculated with the student’s t test. (Bottom panels) ChIP assays measuring the abundance of H3K36me3 trimethylation in FGFR-2 in the indicated cell lines before and after a 2 hour treatment with 5 μM MK2206 or with DMSO. Bars show the fold enrichment of the abundance of H3K36me3 trimethylation in DMSO-treated vs Akt inhibitor-treated cells (mean ± SD).
(D) The knockdown of Akt1 and/or Akt3 promotes inclusion of the IIIb exon in the FGFR-2 transcript. Lysates of NCI H1299 cells harvested 48 hours after transfection with siAKT1, siAkt2, siAkt3 or siControl, were probed with the indicated antibodies (left). IIIb/IIIc ratios were measured by quantitative RT-PCR (right). Bars show the IIIb/IIIc ratio in siAkt vs si-control cells (mean ± SD).
(E) The Akt-independent mutant IWS1-DE reversed the MK2206-induced shift in FGFR-2 alternative splicing. RNA isolated from MK2206 or DMSO-treated NCI H522 and NCI H1299 cells transduced with the IWS1 phosphomimetic mutant IWS1-DE or the empty vector, was analyzed for the IIIb/IIIc ratio by quantitative RT-PCR. Bars show the IIIb/IIIc ratio in MK2206-treated, vs DMSO-treated cells (mean ± SD).
(F) FGFR-2 splicing shifts toward the IIIc transcript in response to IGF1. RNA from the cells in figure 3A was analyzed for the IIIb/IIIc ratio by quantitative RT-PCR. Bars show the IIIb/IIIc ratio in IGF1-treated vs untreated cells (mean ± SD).
(G and H) IWS1 phosphorylation is required for the binding of MRG15 to FGFR-2. ChIP assays showing the binding of MRG15 to the indicated sites in the FGFR-2 and GAPDH genes in shControl, shIWS1, shIWS1/wt rescue and shIWS1/mutant rescue NCI H522 (G) and NCI H1299 (H) cells. Bars show the mean fold enrichment in MRG15 binding in shControl vs shIWS1 or in shIWS1/wt rescue vs shIWS1/mutant rescue cells ± SD.
(I and J) IWS1 phosphorylation is required for the binding of PTB to FGFR-2. ChIP assays showing the binding of myc-PTB to the indicated sites in the FGFR-2 and GAPDH genes in shControl, shIWS1, shIWS1/wt rescue and shIWS1/mutant rescue NCI H522 (I) and NCI H1299 (J) cells, transfected with a myc-PTB construct. The expression of myc-PTB is shown in figure S4E. Bars show the mean fold enrichment in myc-PTB binding in shControl vs shIWS1 or in shIWS1/wt rescue vs shIWS1/mutant rescue cells ± SD. Myc-PTB binding is also presented as percentage of the input in figure S4E.

