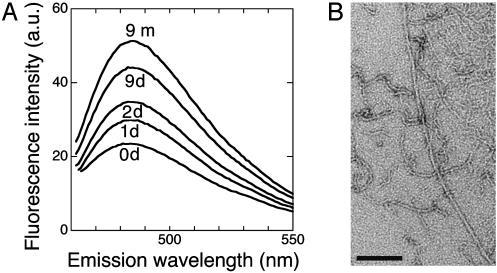
Fig. 2.
(A) Thioflavine T fluorescence spectra of the 0SS solution incubated for (from bottom to top) 0, 1, 2, and 9 days, and 9 months at 25°C, in 50 mM sodium maleate (pH 2.0) at 8.0 mg·ml–1 protein concentration. (B) Electron microgram of the 0SS fibrous aggregate formed after 8 months of incubation in 20 mM sodium acetate (pH 4.0) at a protein concentration of 2.5 mg·ml–1. (Scale bar, 100 nm.) The fraction of thin and curved fibrils was higher in sodium maleate buffer than in sodium acetate buffer.

