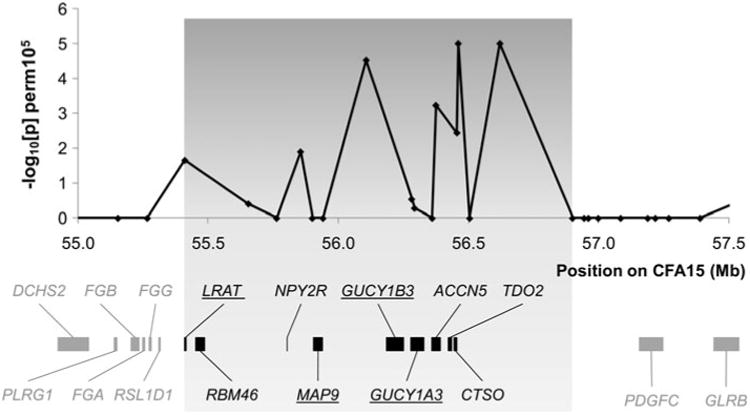
Fig. 5.

Regional map of association with EORD on CFA15 (10,000 permutations) and the genes at the locus. The region highlighted in grey encompasses the 1.49 Mb EORD critical interval defined by homozygosity mapping and haplotype analysis (CFA15: 55.41–56.90 Mb, CanFam2.0). The locations of the corresponding known and predicted genes (Ensembl release 50, NCBI) are shown below the association plot. The four positional–functional candidate genes resequenced are underlined
