
Fig. 3.
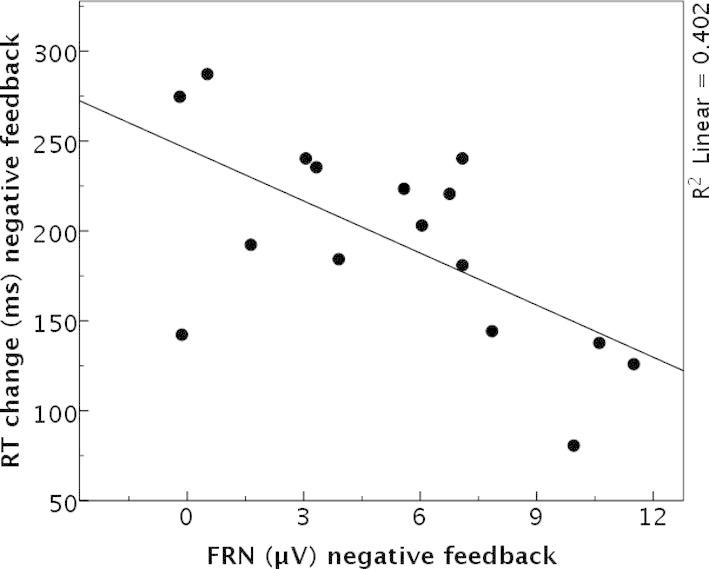
Scatter plot including a regression line of the FRN mean amplitudes (in μV) for negative feedback and the change in reaction times (in ms) after negative feedback of experiment 2.
Official websites use .gov
A
.gov website belongs to an official
government organization in the United States.
Secure .gov websites use HTTPS
A lock (
) or https:// means you've safely
connected to the .gov website. Share sensitive
information only on official, secure websites.
Scatter plot including a regression line of the FRN mean amplitudes (in μV) for negative feedback and the change in reaction times (in ms) after negative feedback of experiment 2.