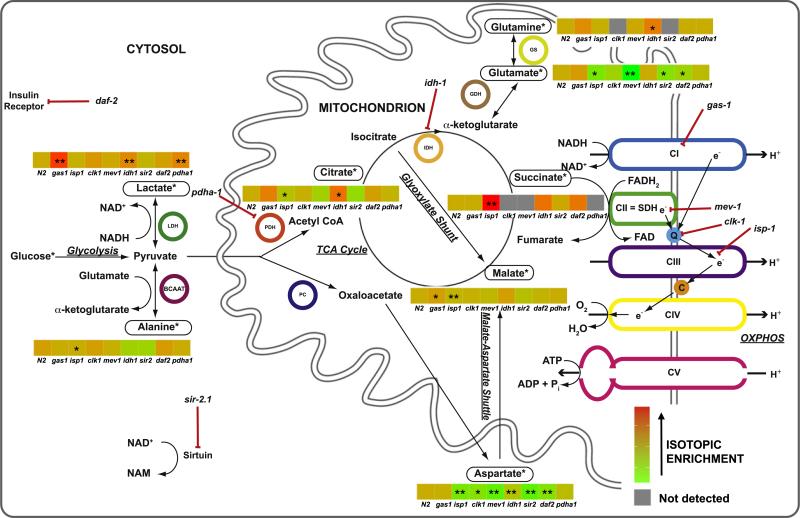
Fig. 5.
Heatmap of metabolite alterations observed in all metabolic mutant C. elegans strains studied by HPLC and/or IR/MS following 1,6-13C2-glucose ingestion throughout development. Heatmap conveys differences in mean isotopic enrichment for each labeled +1 metabolite tested between each metabolic mutant C. elegans strain and wild-type (N2) worms. Red and green convey increased and decreased enrichment, respectively, in the mutant strain relative to wild-type. Statistical significance determined by random effect ANOVA is conveyed by asterisks in colored heatmap boxes, where * is p < 0.05 (unadjusted for multiple comparisons) and ** is p b0.05 (adjusted for multiple comparisons). The remainder of the symbols and abbreviations is the same as detailed in the legend for Fig. 2.

