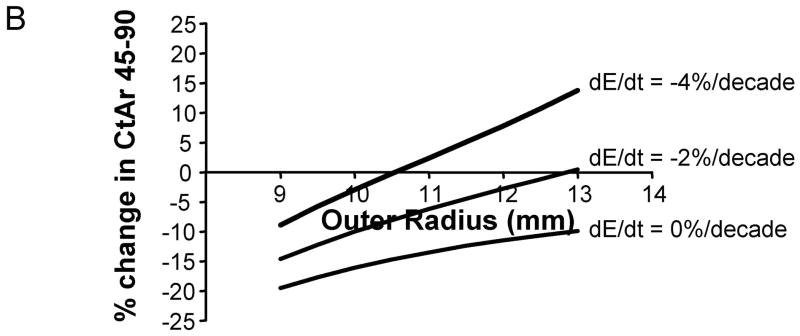
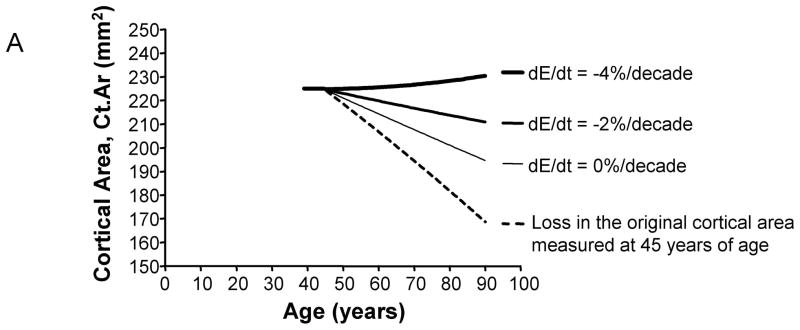
Figure 5.

A) Age-related changes in cortical area are shown here for a representative morphological condition (radius = 11 mm). The net changes in cortical area over time vary widely, depending on the magnitude of tissue-modulus degradation rate. Age-changes in the original cortical area (dashed line) are shown for comparison. In this simulation, all bones lost the same amount of bone over time. Consequently, differences in how cortical area changed over time for the 0%, −2%, and −4%/decade tissue-modulus degradation rates could be attributed to the amount of bone added to the periosteal surface to compensate for the endocortical loss. B) The percentage change in cortical area from 45 to 90 years varied with bone size and tissue-modulus degradation rate. These curves are shown for the general condition (Ct.ArS = Ct.ArR). Similar effects were observed for the 66% (Ct.ArS < Ct.ArR) and 38% (Ct.ArS ≪ Ct.ArR) sites.

