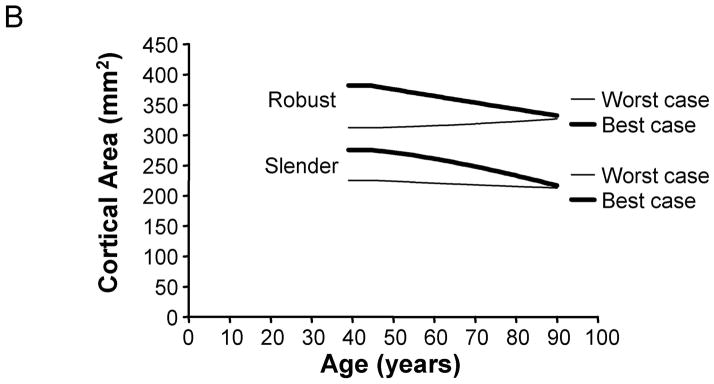
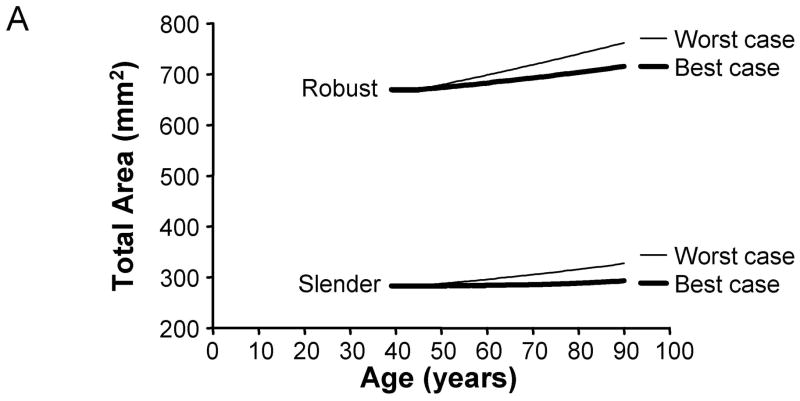
Figure 7.

Variation in aging-paths as represented by changes in A) total area and B) cortical area over time. Graphs are shown for the 66% site for women, and the results are presented for the most slender and most robust diaphyses. The best and worst case scenarios are shown for illustration purposes. The best case scenario involves a 10% increase in adult cortical area and a 0%/decade tissue-modulus degradation rate. The worst case scenario involves a 10% reduction in adult cortical area and a −4%/decade tissue-modulus degradation rate. These graphs represent how morphology must change over time for each scenario in order to maintain stiffness during aging. Importantly, the best case scenario shows greater losses in cortical area over time compared to the worst case scenario, because the worst case scenario requires greater periosteal apposition in order to compensate for the same percentage of bone loss.

