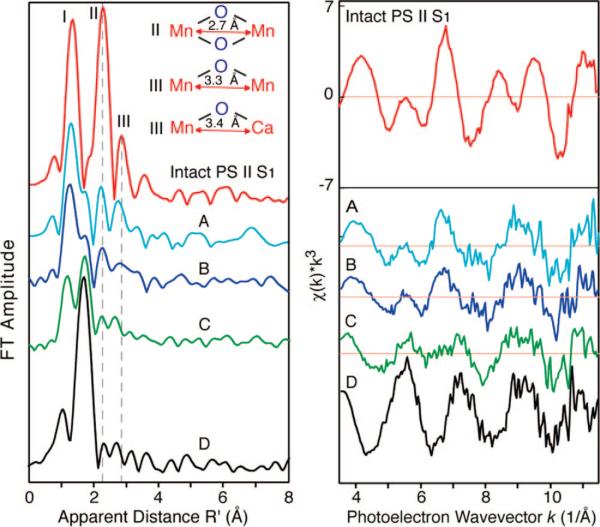
Figure 5.
Spectral changes of PS II Mn EXAFS due to radiation damage. (left) The FT of the EXAFS spectrum from an intact PS II solution sample is on top (red). The FTs from PS II solution samples exposed to 0.05, 0.1, 0.3, and 1.4 × 10¹⁰ photons/μm2 at 13.3 keV and 100 K and containing 25 (blue), 35 (dark blue), 45 (green), and 90% (black) photoreduced Mn(II) are labeled A–D, respectively. An average dose of ~3.5 × 10¹⁰ photons/μm2 was used for XRD studies. (right) Corresponding k3-space EXAFS spectra of PS II In addition to Mn reduction, the EXAFSsamples. The figure is adapted from Yano et al.23

