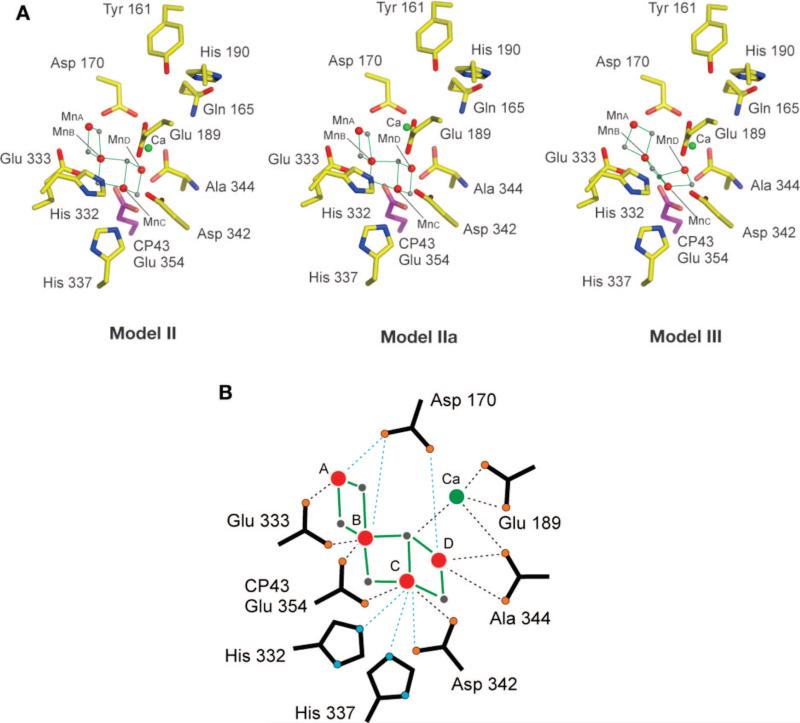
Figure 8.
(A) Structural models II, IIa, and III placed in the ligand environment from the XRD data of Loll et al.22 at a resolution of 3.0 Å. The center of mass was translated to the center of the electron density attributed to the Mn4Ca cluster in the XRD structure. This was carried out without any rotation of the models. (B) Schematic diagram of model II with the view along the membrane plane, with putative ligands from the electron density. Bonds between Mn and the bridging oxo are shown as solid green lines. Bonds to putative terminal ligand atoms from amino acids and to Ca atoms are shown as dotted lines (black, <3.0 Å; blue, >3.0 Å).

