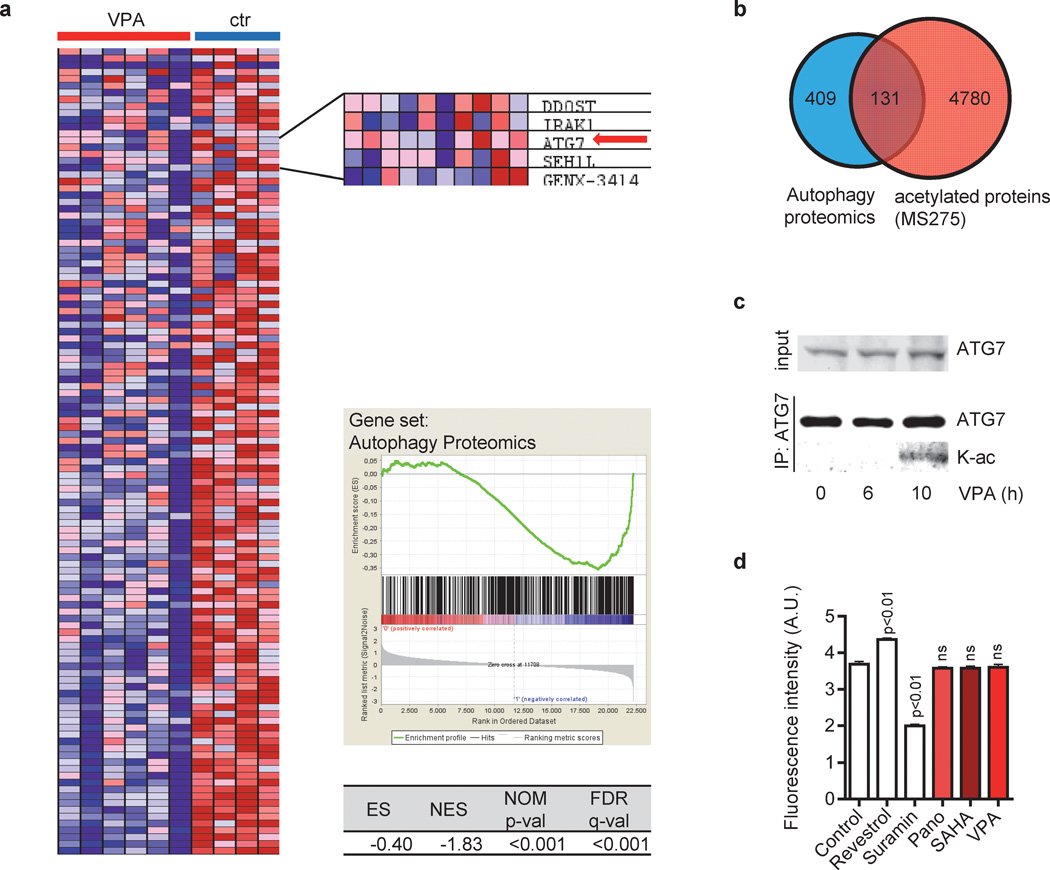
Figure 3. HDACis target the autophagy interaction network.
(a) GSEA of CMY and CMK cells with (VPA) and without (ctr) VPA treatment using a set of 409 genes of the autophagy interaction network, as determined by a proteomic approach (20). GSEA indicated the repression of those key autophagy genes by VPA. Cells were treated for 24h and 48h with 1mM or 2mM VPA. Left - heat map. Right – inlet showing selected genes including ATG7 (red arrow), enrichment plots and statistics. (b) Venn diagram showing the overlap of 409 proteins of the autophagy interaction network (20) and 4780 proteins which are acetylated in response to HDACi treatment of leukemic cell lines (25). (c) Western blots of immunoprecipitated ATG7 using ATG7 and acetyl-Lysin antibody of CMK cells with or without incubation with 2mM VPA for 6h and 10h. (d) SIRT1 activity was measured using the SIRT1 Fluorometric Drug Discovery Kit. Recombinant human SIRT1 was pre-incubated with Panobinostat (2µM), SAHA (2 µM) or VPA (2mM) for 2h. Resveratrol and suramin sodium were included as positive controls for SIRT1 activation and inhibition, respectively. Experiments are presented as mean±s.d. and are representative for at least three independent experiments with two replicates.

