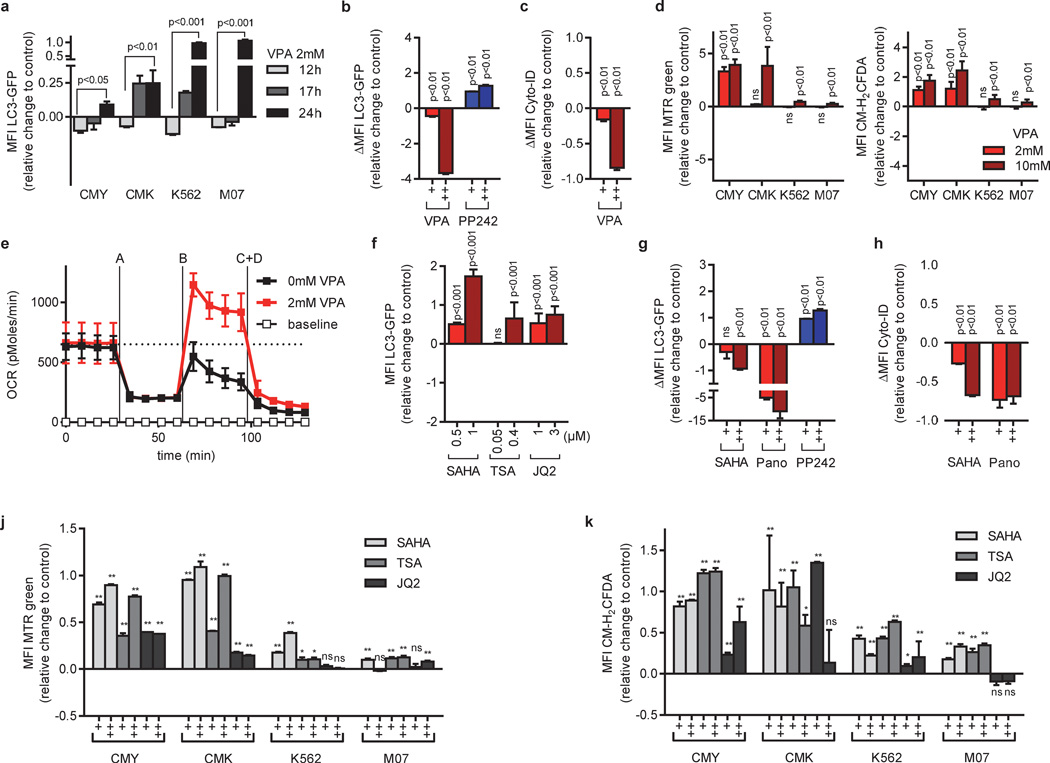
Figure 4. HDACis inhibit autophagy leading to the accumulation of mitochondria and ROS.
(a) Flow cytometric analysis (MFI±s.d) of autophagic flux in CMY, CMK, K562 and M07 cells expressing LC3-GFP after VPA (2mM) treatment. The bar graph represents the level of LC3 GFP cellular abundance with respect to the control. Values above 0 indicate inhibition of autophagic flux, while values below 0 indicate activation of autophagic flux. (b) Autophagic flux of LC3-GFP cells treated with VPA (0.2, 2 mM) or PP242 (2, 5µM) in the presence or absence of chloroquine (CQ). ΔMFI LC3-GFP= MFI LC3-GFP (+CQ) - MFI LC3-GFP (-CQ). Values below 0 indicate inhibition of autophagic flux, while values above 0 indicate autophagy activation. (c) ΔMFI Cyto-ID measured in CMY cells incubated with VPA (0.4 and 2mM). ΔMFI Cyto-ID= MFI Cyto-ID (+NH4Cl) - MFI Cyto-ID (-NH4Cl). Values below 0 indicate inhibition of autophagic flux, while values above 0 indicate autophagy activation. (d) Mitochondrial pool (left) or ROS production (right) analyzed by flow cytometry (MFI±s.d.) of MitoTracker Green (MTR)-stained or CM-H2DCFDA treated CMY, CMK, K562 and M07 cells (VPA: 2 and 10mM), respectively. (e) Diagram showing the oxygen consumption rate (OCR). The basal respiration rate, oligomycin-sensitive respiration rate (A), the maximal respiration rate (B) and the non-mitochondrial respiration rate (C+D) measured in CMK cells. PANOVA= 5×10⁻⁷ (AUC 2mM VPA vs AUC 0mM VPA). (f) Flow cytometric analysis of autophagic flux in CMY cells expressing LC3-GFP (MFI±s.d) after SAHA (0.5 and 1µM), TSA (0.05, 0.4µM) or JQ2 (1, 3µM) treatment. As in (A), values above 0 indicate inhibition of autophagic flux, while values below 0 indicate activation of autophagic flux. (g) Autophagic flux of LC3-GFP expressing cells treated with SAHA (0.2 and 2µM), Panobinostat (0.2 and 2µM) or PP242 (2, 5µM) in the presence and absence of CQ. (h) ΔMFI Cyto-ID signal in CMY cells treated with SAHA (0.4, 2) or Panobinostat (0.1, 0.4). (j–k) Diagrams showing the (j) mitochondrial pool (MTR; MFI±s.d.) and (k) ROS production (CM-H2DCFDA; MFI ±s.d.) analyzed by flow cytometry of CMY, CMK, K562 and M07 cells treated with SAHA (0.5, 1µM), TSA (0.05, 0.4µM) or JQ2 (1, 3µM). (a–d) and (f–k) Data are presented as change relative to the control (=0). (a–k) Data are representative for three independent experiments with two to eight replicates. *P<0.05; **P<0.01.

