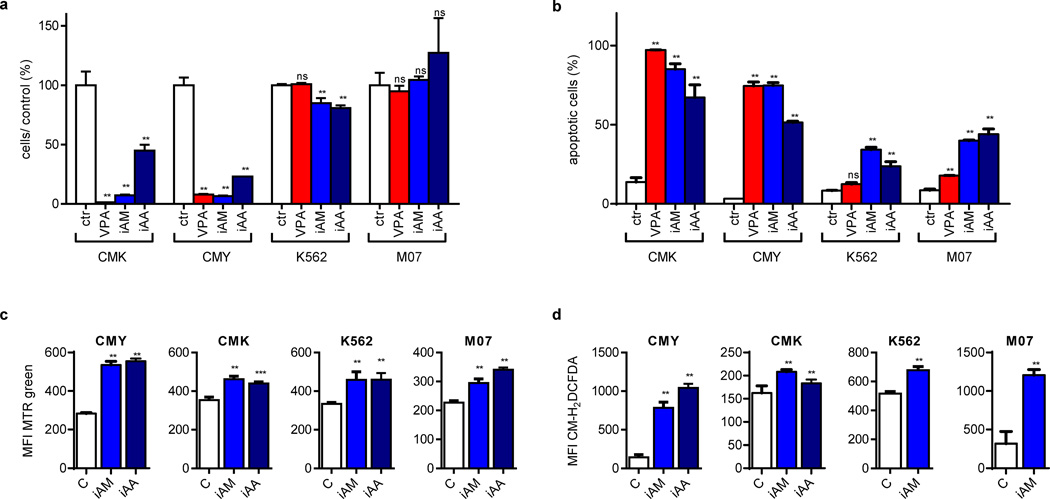
Figure 5. Pharmacologic inhibition of autophagy recapitulates the effects of HDACis on DS-AMKL cells.
(a) Number of viable cells 48h after incubation with VPA (2mM), inhibitors of autophagosome maturation (iAM: vinblastine and nocodazole) and inhibitors of autophagosome acidification (iAA: ammonium chloride, chloroquine and hydroxychloroquine) in relation to the untreated control cells (ctr; =100%). (b) Percentage of Annexin V+ cells 48h after addition of VPA (2mM), iAM or iAA in comparison to the untreated control cells (ctr). (c–d) Diagrams showing (c) the mitochondrial pool of (MTR; MFI±s.d.) and (d) ROS production (CM-H2DCFDA; MFI±s.d.) of CMY, CMK, K562 and M07 cells after addition of iAM or iAA as analyzed by flow cytometry (MFI±s.d.). (a–d) All experiments are presented as mean±s.d of at least two independent experiments with two to four replicates. *P<0.05; **P<0.01; ***P<0.001.

