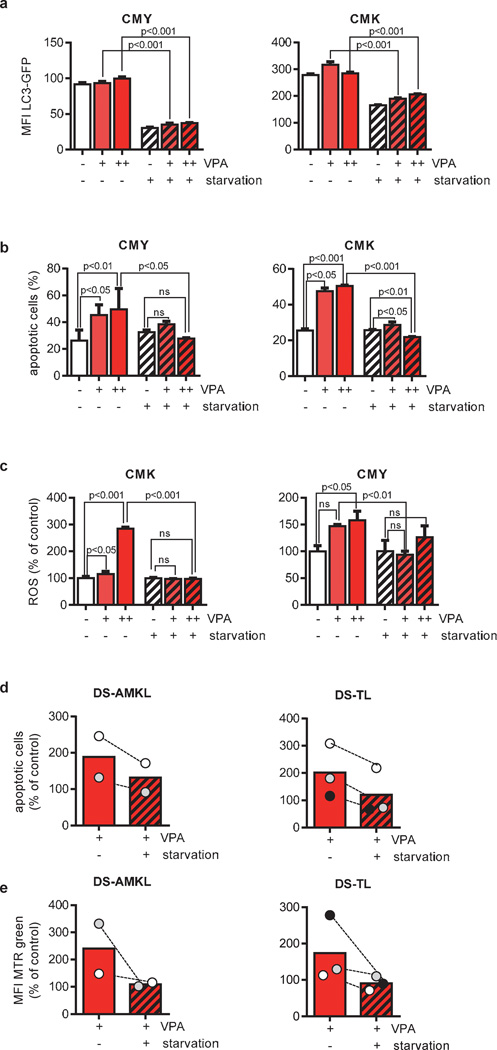
Figure 6. Starvation reversed VPA-mediated suppression of autophagic flux.
(a) Flow cytometric analysis of autophagic flux in CMY and CMK cells expressing LC3-GFP (MFI±s.d.) after incubation with VPA (0.5, 2mM) for 24h in cell culture or starvation medium. (b) Percentage of apoptotic CMY and CMK cells treated with VPA (2, 10mM) for 30h in cell culture or starvation medium. The subdiploid fraction was detected by flow cytometry after PI nuclear staining. (c) ROS production as analyzed by flow cytometry (MFI±s.d.) of CM-H2DCFDA-treated CMK and CMY cells 30h after treatment with VPA (2, 10mM) in cell culture or starvation medium. (d) Bars represent the mean percentage of apoptotic primary DS-AMKL (n=2) or DS-TL cells (n=3) 16 to 24h after treatment with VPA (10mM) under normal or starvation condition in relation to the untreated control (=100%). The subdiploid fraction was detected by flow cytometry after PI nuclear staining. (e) Mitochondrial pool analyzed by flow cytometry (MFI±s.d.) of MTR-stained DS-AMKL (n=2) or DS-TL cells (n=3) 16 to 24h after treatment with VPA (10mM) in cell culture or in starvation medium in relation to the untreated control (=100%). (d–e) Data from one experiment with triplicates presented as distribution of the mean value.

