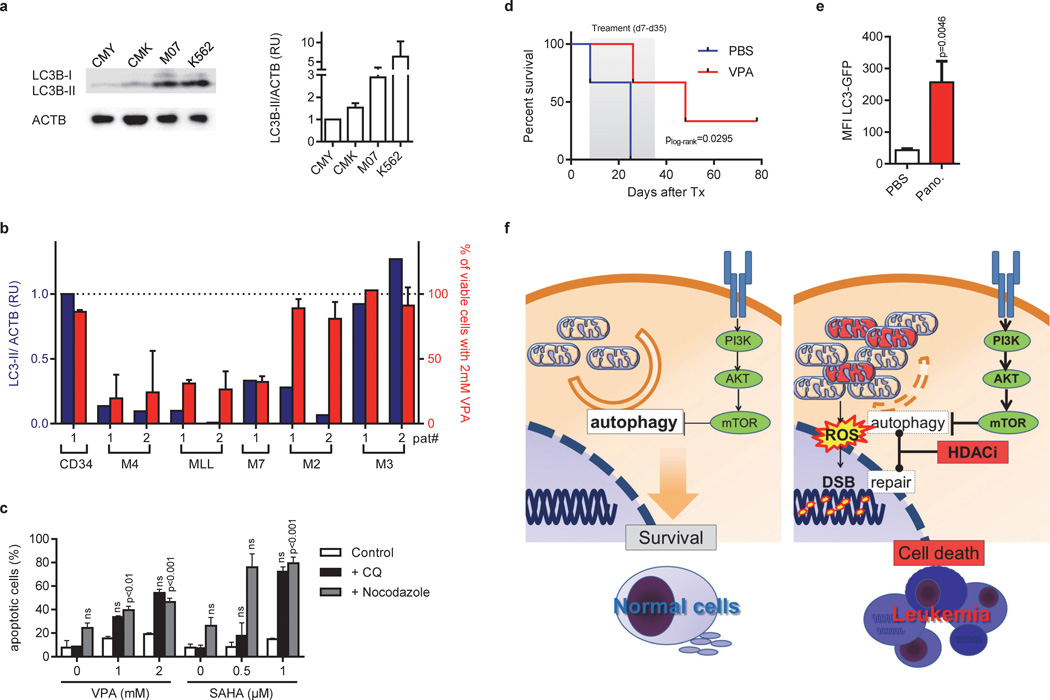
Figure 8. Low constitutive autophagic activity determines the susceptibility to HDACis in vitro and in vivo.
(a) Immunoblot analysis of LC3-I and LC3-II isoforms in CMY, CMK, M07 and K562 cells using anti-LC3B antibody, normalized to ACTB. The right diagram shows quantification of LC3-II expression relative to ACTB assessed by densitometry. Data are representative for at least three independent experiments performed in replicates. *P<0.05; **P<0.01. (b) Diagram showing the level of LC3-II normalized to ACTB assessed by densitometry (blue bars and blue Y-axis) and the percent of viable cells determined by luminescent cell viability assay (red bars and red Y-axis) from patients with AML FAB M4eo (n=2), AML with MLL rearrangement (n=2), AML FAB M3 (n=2), AML FAB M2 (n=2), AML FAB M7 (or non-DS-AMKL; n=1) and in CD34+-HSPCs (n=1) samples. Viability was determined for cells grown in liquid culture for 48h after addition of 2mM VPA in relation to the untreated control (100%). (c) Percentage of Annexin V+ apoptotic K562 cells treated with indicated concentrations VPA or SAHA for 48h with or without addition of chloroquine (CQ) or nocodazol. (a–c) The data is a representative of at least two independent experiments with two replicates. (d) Kaplan-Meier analysis of NRG mice transplanted i.f. with CMY cells treated with PBS (n=3) or 400mg/kg/day VPA (n=3) i.p. for 28 days, starting 7 days after transplantation. (e) Flow cytometric analysis (MFI±s.d.) of autophagic flux in K562 cells expressing LC3-GFP isolated from NRG mice transplanted i.f. and treated with PBS (n=3) or 10 mg/kg/day Panobinostat (n=4) i.p. for 3 days, starting 28 days after transplantation. (f) Model illustrating the mechanism of VPA-induced apoptosis in DS-AMKL cells with PI3K/mTOR overactivation. In comparison to normal cells (left), PI3K/mTOR activation suppresses basal autophagy to a critical threshold that still allows equilibrium of organelle/ mitochondria and protein aggregate turnover or clearance. Further suppression by HDAC inhibition results in the accumulation of dysfunctional mitochondria, which trigger the intrinsic pathway of apoptosis and ROS production, that causes DNA-damage (right). The repair of DSBs is hampered by direct inhibition of key repair enzymes by HDAC inhibition (16;34).

